This document provides reference tables for New Zealand’s critical infrastructure. Coordinates are WGS84 (decimal degrees). All data current to 2023–2024 unless noted.
Maps: NZ Infrastructure Overview | Wellington Region Detail
1. Major Cities
Source: Stats NZ 2023 Census usually-resident population counts. Elevation is approximate urban core elevation (metres above mean sea level).
| City | Population (2023) | Longitude | Latitude | Region | Elevation (m) |
|---|---|---|---|---|---|
| Auckland | 1,695,200 | 174.7633 | -36.8485 | Auckland | 196 |
| Hamilton | 176,500 | 175.2793 | -37.7870 | Waikato | 40 |
| Tauranga | 155,200 | 176.1651 | -37.6878 | Bay of Plenty | 5 |
| Wellington | 215,400 | 174.7762 | -41.2865 | Wellington | 126 |
| Christchurch | 389,700 | 172.6362 | -43.5321 | Canterbury | 4 |
| Dunedin | 130,400 | 170.5028 | -45.8788 | Otago | 2 |
| Napier-Hastings | 135,600 | 176.9150 | -39.4928 | Hawke’s Bay | 6 |
| Palmerston North | 90,400 | 175.6083 | -40.3523 | Manawatu-Whanganui | 62 |
| Nelson | 53,600 | 173.2840 | -41.2706 | Nelson | 6 |
| New Plymouth | 84,000 | 174.0752 | -39.0556 | Taranaki | 52 |
| Invercargill | 56,500 | 168.3538 | -46.4132 | Southland | 3 |
| Rotorua | 61,800 | 176.2497 | -38.1368 | Bay of Plenty | 280 |
| Whangarei | 57,600 | 174.3236 | -35.7275 | Northland | 15 |
| Queenstown | 15,800 | 168.6626 | -45.0312 | Otago | 310 |
| Lower Hutt | 112,000 | 174.9080 | -41.2090 | Wellington | 10 |
| Upper Hutt | 46,000 | 175.0710 | -41.1240 | Wellington | 50 |
| Porirua | 60,000 | 174.8400 | -41.1340 | Wellington | 10 |
| Paraparaumu | 33,000 | 174.9900 | -40.9050 | Wellington | 5 |
2. Commercial Ports
Throughput figures are approximate annual averages (2022–2023). TEU = twenty-foot equivalent unit (containerised cargo). Max vessel size reflects current regular callers.
| Port | Longitude | Latitude | Throughput | Unit | Max Vessel | Key Exports / Notes |
|---|---|---|---|---|---|---|
| Auckland | 174.7700 | -36.8440 | 900,000 | TEU | Post-Panamax | Manufactured goods, vehicles, containers |
| Tauranga | 176.1840 | -37.6471 | 1,400,000 | TEU | Post-Panamax | Logs, kiwifruit, dairy, bulk |
| Lyttelton | 172.7197 | -43.6034 | 400,000 | TEU | Panamax | Wool, meat, grain, coal |
| Napier | 176.9100 | -39.4780 | 460,000 | TEU | Panamax | Logs, apples, meat |
| Wellington | 174.7850 | -41.2770 | 135,000 | TEU | Panamax | General cargo, containers |
| Port Chalmers | 170.6270 | -45.8130 | 130,000 | TEU | Panamax | Wool, meat, seafood, grain |
| Bluff | 168.3530 | -46.6000 | 2,100,000 | tonnes | Panamax | Aluminium, fertiliser, grain |
| Nelson | 173.2890 | -41.2580 | 900,000 | tonnes | Coastal | Fish, timber, apples |
| New Plymouth | 174.0570 | -39.0600 | 1,200,000 | tonnes | Handymax | Petroleum products, fertiliser |
| Timaru | 171.2560 | -44.3900 | 350,000 | TEU | Handymax | Grain, wool, meat, logs |
| Marsden Point | 174.5060 | -35.8320 | 5,000,000 | tonnes | Aframax | Crude oil import terminal (former refinery) |
Note: Port of Tauranga is New Zealand’s largest port by volume. Marsden Point ceased refining in 2022 and now operates as an import terminal.
3. Airports
Runway length is the longest paved runway. ICAO codes follow standard NZ prefix ‘NZ’. International airports hold ICAO-certified customs and biosecurity facilities.
| Name | ICAO | Longitude | Latitude | Runway (m) | Surface | Capabilities |
|---|---|---|---|---|---|---|
| Auckland International | NZAA | 174.7919 | -37.0082 | 3635 | Asphalt | International, wide-body, freight hub |
| Wellington International | NZWN | 174.8051 | -41.3272 | 2081 | Asphalt | International, narrow-body, exposed crosswind |
| Christchurch International | NZCH | 172.5320 | -43.4894 | 3288 | Asphalt | International, wide-body, Antarctic gateway |
| Queenstown Airport | NZQN | 168.7392 | -45.0210 | 1800 | Asphalt | International, narrow-body, mountain approach |
| Dunedin International | NZDN | 170.1983 | -45.9281 | 2774 | Asphalt | Domestic/limited international |
| Hamilton Airport | NZHN | 175.3322 | -37.8667 | 2743 | Asphalt | Domestic, freight |
| Palmerston North Airport | NZPM | 175.6172 | -40.3206 | 1900 | Asphalt | Domestic |
| Napier/Hawke’s Bay Airport | NZNH | 176.8700 | -39.4658 | 1800 | Asphalt | Domestic |
| Nelson Airport | NZNS | 173.2211 | -41.2983 | 1350 | Asphalt | Domestic |
| Invercargill Airport | NZNV | 168.3131 | -46.4124 | 2191 | Asphalt | Domestic |
| Rotorua Airport | NZRO | 176.3172 | -38.1092 | 1800 | Asphalt | Domestic |
| Tauranga Airport | NZTG | 176.1961 | -37.6719 | 1830 | Asphalt | Domestic, helicopter ops |
4. Power Generation
Installed capacity in megawatts (MW). New Zealand generates approximately 80–85% of electricity from renewable sources in a normal year. Hydro is dominant; geothermal provides reliable baseload; gas/coal (Huntly) is used for dry-year backup. Wind is growing rapidly.
| Station | Type | Longitude | Latitude | Capacity (MW) | Operator |
|---|---|---|---|---|---|
| Manapouri | hydro | 167.6070 | -45.5310 | 850 | Meridian Energy |
| Clyde | hydro | 169.3280 | -45.1990 | 432 | Contact Energy |
| Roxburgh | hydro | 169.3180 | -45.5440 | 320 | Contact Energy |
| Benmore | hydro | 170.2050 | -44.5220 | 540 | Meridian Energy |
| Aviemore | hydro | 170.2840 | -44.6530 | 220 | Meridian Energy |
| Ohau A/B/C | hydro | 169.8700 | -44.2400 | 560 | Meridian Energy |
| Tekapo A/B | hydro | 170.4430 | -43.8840 | 195 | Genesis Energy |
| Waitaki | hydro | 170.4120 | -44.9290 | 105 | Meridian Energy |
| Wairakei | geothermal | 176.0840 | -38.6270 | 181 | Contact Energy |
| Kawerau | geothermal | 176.7010 | -38.0890 | 100 | Mercury NZ |
| Ngatamariki | geothermal | 176.1690 | -38.5260 | 82 | Mercury NZ |
| Nga Awa Purua | geothermal | 176.1800 | -38.5600 | 140 | Mercury NZ |
| Rotokawa | geothermal | 176.1950 | -38.5970 | 176 | Mercury NZ |
| Huntly | gas/coal | 175.1550 | -37.5540 | 400 | Genesis Energy |
| Stratford (TCC) | gas | 174.2800 | -39.3540 | 200 | Todd Energy |
| Te Apiti Wind | wind | 175.8550 | -40.0920 | 90 | Meridian Energy |
| Tararua Wind | wind | 175.8480 | -40.4730 | 161 | Meridian Energy |
| White Hill Wind | wind | 168.3700 | -45.8700 | 58 | Meridian Energy |
| Mahinerangi Wind | wind | 169.8400 | -45.9200 | 36 | Contact Energy |
| Hauāuru mā Raro | wind | 174.6830 | -37.7620 | 64 | Mercury NZ |
| Haywards Substation | grid hub | 174.9820 | -41.1560 | 0 | Transpower |
| West Wind | wind | 174.6800 | -41.3300 | 143 | Meridian Energy |
Waitaki chain comprises: Waitaki, Aviemore, Benmore, Ohau A/B/C, Tekapo A/B — combined capacity approximately 1,620 MW. Loss of this chain would be a national crisis.
5. Major Hospitals
Bed counts are approximate licensed bed capacity. Trauma levels follow NZ designation: Level 1 = comprehensive tertiary trauma centre; Level 2 = regional trauma centre. All listed hospitals have emergency departments.
| Hospital | City | Longitude | Latitude | Beds | Trauma Level | Helipad |
|---|---|---|---|---|---|---|
| Auckland City Hospital | Auckland | 174.7700 | -36.8633 | 1100 | Level 1 | Yes |
| Middlemore Hospital | Auckland | 174.8380 | -36.9660 | 850 | Level 1 | Yes |
| Waikato Hospital | Hamilton | 175.2880 | -37.7910 | 650 | Level 1 | Yes |
| Wellington Regional Hospital | Wellington | 174.7760 | -41.3080 | 600 | Level 1 | Yes |
| Christchurch Hospital | Christchurch | 172.6290 | -43.5340 | 700 | Level 1 | Yes |
| Dunedin Hospital | Dunedin | 170.5050 | -45.8700 | 430 | Level 2 | Yes |
| Palmerston North Hospital | Palmerston North | 175.6130 | -40.3620 | 390 | Level 2 | Yes |
| Hawke’s Bay Regional Hospital | Napier-Hastings | 176.8820 | -39.6290 | 370 | Level 2 | Yes |
| Nelson Hospital | Nelson | 173.2870 | -41.2750 | 230 | Level 2 | Yes |
| Taranaki Base Hospital | New Plymouth | 174.0600 | -39.0640 | 320 | Level 2 | Yes |
| Hutt Hospital | Lower Hutt | 174.9220 | -41.1960 | 280 | Level 2 | Yes |
| Kenepuru Hospital | Porirua | 174.8270 | -41.1330 | 60 | Level 3 | No |
6. Key Industrial Sites
Sites selected for strategic importance in a recovery context: unique capabilities, large-scale output, or no domestic substitute.
| Site | Type | Longitude | Latitude | Output | Strategic Importance |
|---|---|---|---|---|---|
| NZ Steel (Glenbrook) | Steel mill | 174.9040 | -37.3120 | 650,000 t/yr steel | Only domestic steel producer; uses ironsands |
| Tiwai Point Aluminium | Aluminium smelter | 168.3750 | -46.5740 | 330,000 t/yr aluminium | Largest power consumer in NZ; uses Manapouri power |
| Methanex Motunui | Methanol plant | 174.0230 | -39.0140 | 2.2 Mt/yr methanol | World’s largest methanol producer; uses Taranaki gas |
| Refining NZ / Marsden Pt | Import oil terminal | 174.5060 | -35.8320 | 6 Mt/yr petroleum | Primary liquid fuel import terminal for North Island |
| Fonterra Edgecumbe | Dairy processing | 176.8330 | -38.1440 | 1.0 Mt/yr dairy | Major whole milk powder export hub |
| Fonterra Tirau | Dairy processing | 175.7590 | -37.9780 | 0.6 Mt/yr dairy | Key whey protein and butter plant |
| Alliance Group Lorneville | Meat freezing works | 168.2800 | -46.3500 | 5 M lamb equiv/yr | Largest single-site red meat processor in NZ |
| Silver Fern Farms Pareora | Meat freezing works | 171.2230 | -44.4780 | 3 M lamb equiv/yr | Major South Canterbury export freezing works |
| Seaview/Gracefield | Industrial area | 174.9100 | -41.2320 | Mixed manufacturing | Wellington region’s main industrial zone; fuel storage, engineering workshops |
| CentrePort container terminal | Container terminal | 174.7810 | -41.2790 | 90,000 TEU/yr | Wellington’s primary freight gateway; interisland ferry terminal adjacent |
NZ Steel (Glenbrook): Uses North Island ironsands via direct reduction — unique process not requiring coking coal. Produces reinforcing bar, rod, and structural sections. Loss would eliminate domestic steel production.
Tiwai Point: Consumes ~13% of national electricity generation. Closure would dramatically alter the South Island power balance and affect Meridian Energy revenue.
7. Inter-City Distance Matrix
Great-circle (Haversine) distances in kilometres between major cities. Road distances will be 10–40% longer due to terrain. Half-matrix shown (upper triangle only).
| City | AKL | HAM | TRG | WLG | CHC | DUN | NPE | PMR | NSN | NPL | IVC | ROT | WHG | QTN | LHT | UHT | POR | KAP |
|---|---|---|---|---|---|---|---|---|---|---|---|---|---|---|---|---|---|---|
| Auckland | — | 114 | 155 | 493 | 765 | 1065 | 349 | 396 | 508 | 253 | 1189 | 194 | 131 | 1044 | 485 | 476 | 477 | 451 |
| Hamilton | — | 79 | 392 | 677 | 982 | 237 | 287 | 423 | 176 | 1115 | 94 | 244 | 976 | 382 | 371 | 374 | 348 | |
| Tauranga | — | 418 | 715 | 1024 | 211 | 300 | 469 | 237 | 1164 | 50 | 273 | 1028 | 406 | 393 | 400 | 372 | ||
| Wellington | — | 305 | 616 | 269 | 125 | 125 | 255 | 768 | 372 | 619 | 647 | 14 | 31 | 18 | 46 | |||
| Christchurch | — | 311 | 573 | 431 | 257 | 512 | 465 | 672 | 880 | 357 | 319 | 334 | 322 | 351 | ||||
| Dunedin | — | 882 | 741 | 559 | 813 | 176 | 982 | 1173 | 172 | 629 | 644 | 633 | 661 | |||||
| Napier-Hastings | — | 147 | 366 | 249 | 1037 | 161 | 477 | 916 | 256 | 239 | 253 | 227 | ||||||
| Palmerston North | — | 221 | 195 | 892 | 252 | 526 | 769 | 112 | 97 | 108 | 81 | |||||||
| Nelson | — | 255 | 695 | 431 | 623 | 561 | 136 | 150 | 131 | 149 | ||||||||
| New Plymouth | — | 942 | 215 | 371 | 800 | 250 | 245 | 240 | 220 | |||||||||
| Invercargill | — | 1125 | 1288 | 156 | 781 | 797 | 784 | 812 | ||||||||||
| Rotorua | — | 318 | 992 | 360 | 347 | 354 | 326 | |||||||||||
| Whangarei | — | 1140 | 612 | 604 | 603 | 579 | ||||||||||||
| Queenstown | — | 661 | 678 | 663 | 689 | |||||||||||||
| Lower Hutt | — | 17 | 10 | 34 | ||||||||||||||
| Upper Hutt | — | 19 | 25 | |||||||||||||||
| Porirua | — | 28 | ||||||||||||||||
| Paraparaumu | — |
Key distances: Auckland–Wellington 493 km (direct); Wellington–Christchurch 300 km (Cook Strait crossing); Auckland–Christchurch 744 km; Christchurch–Invercargill 433 km.
Maps
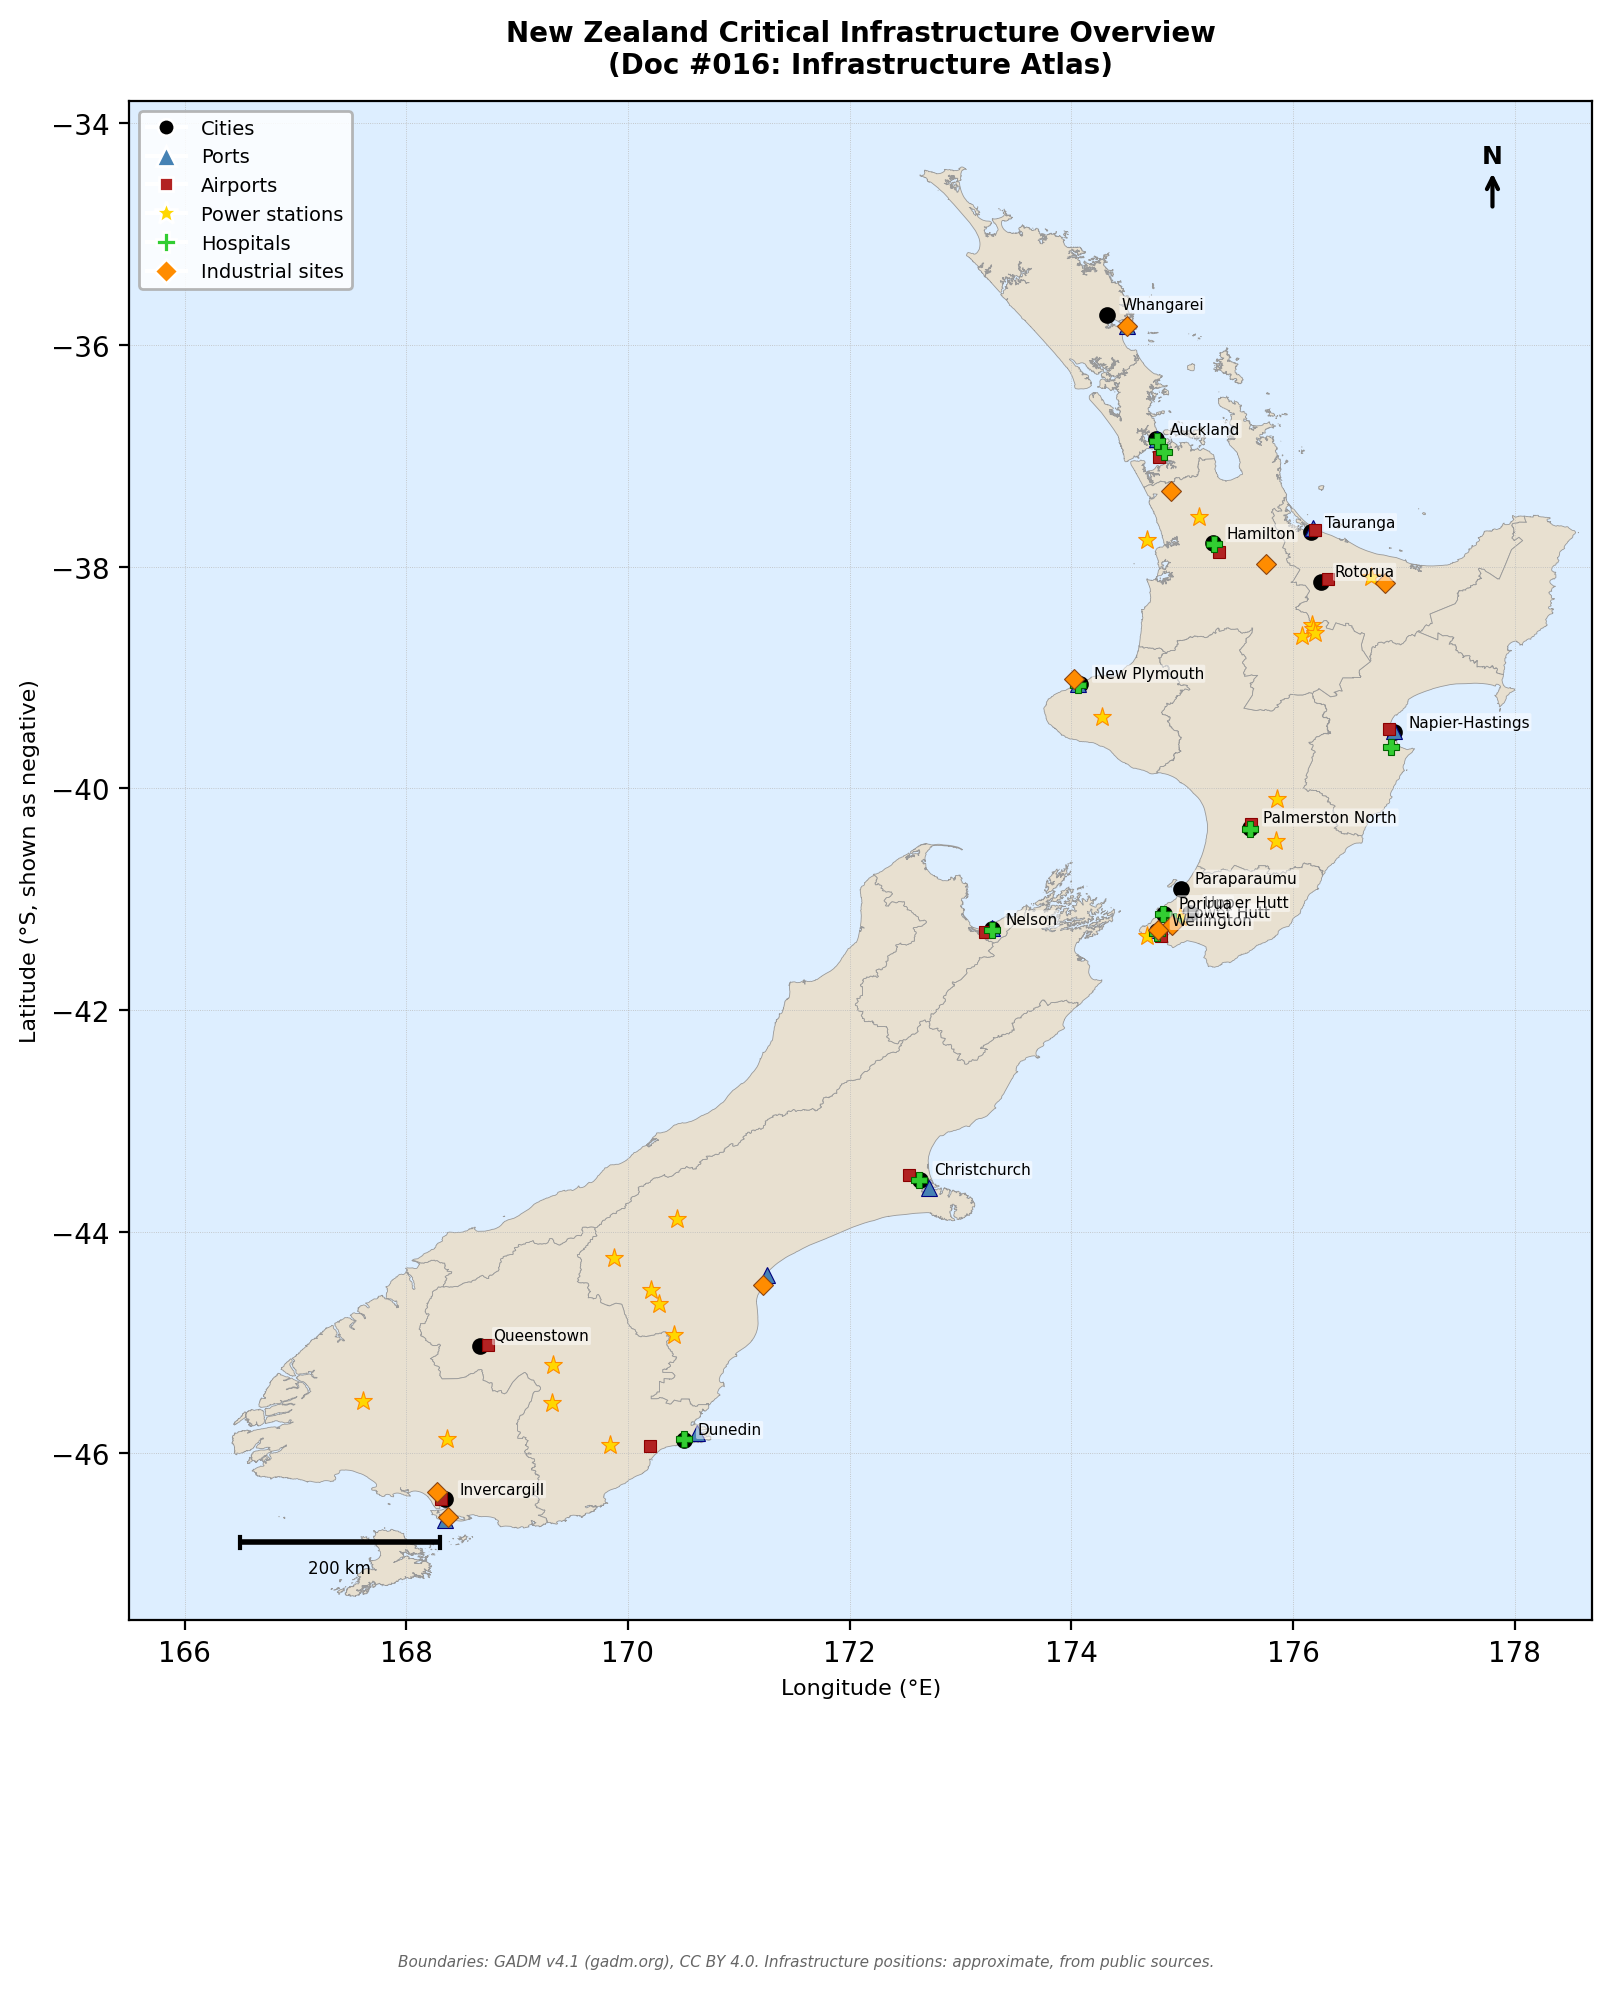
Figure 1: Full New Zealand infrastructure overview. Cities (black dots), ports (blue triangles), airports (red squares), power stations (yellow stars), hospitals (green crosses), industrial sites (orange diamonds).
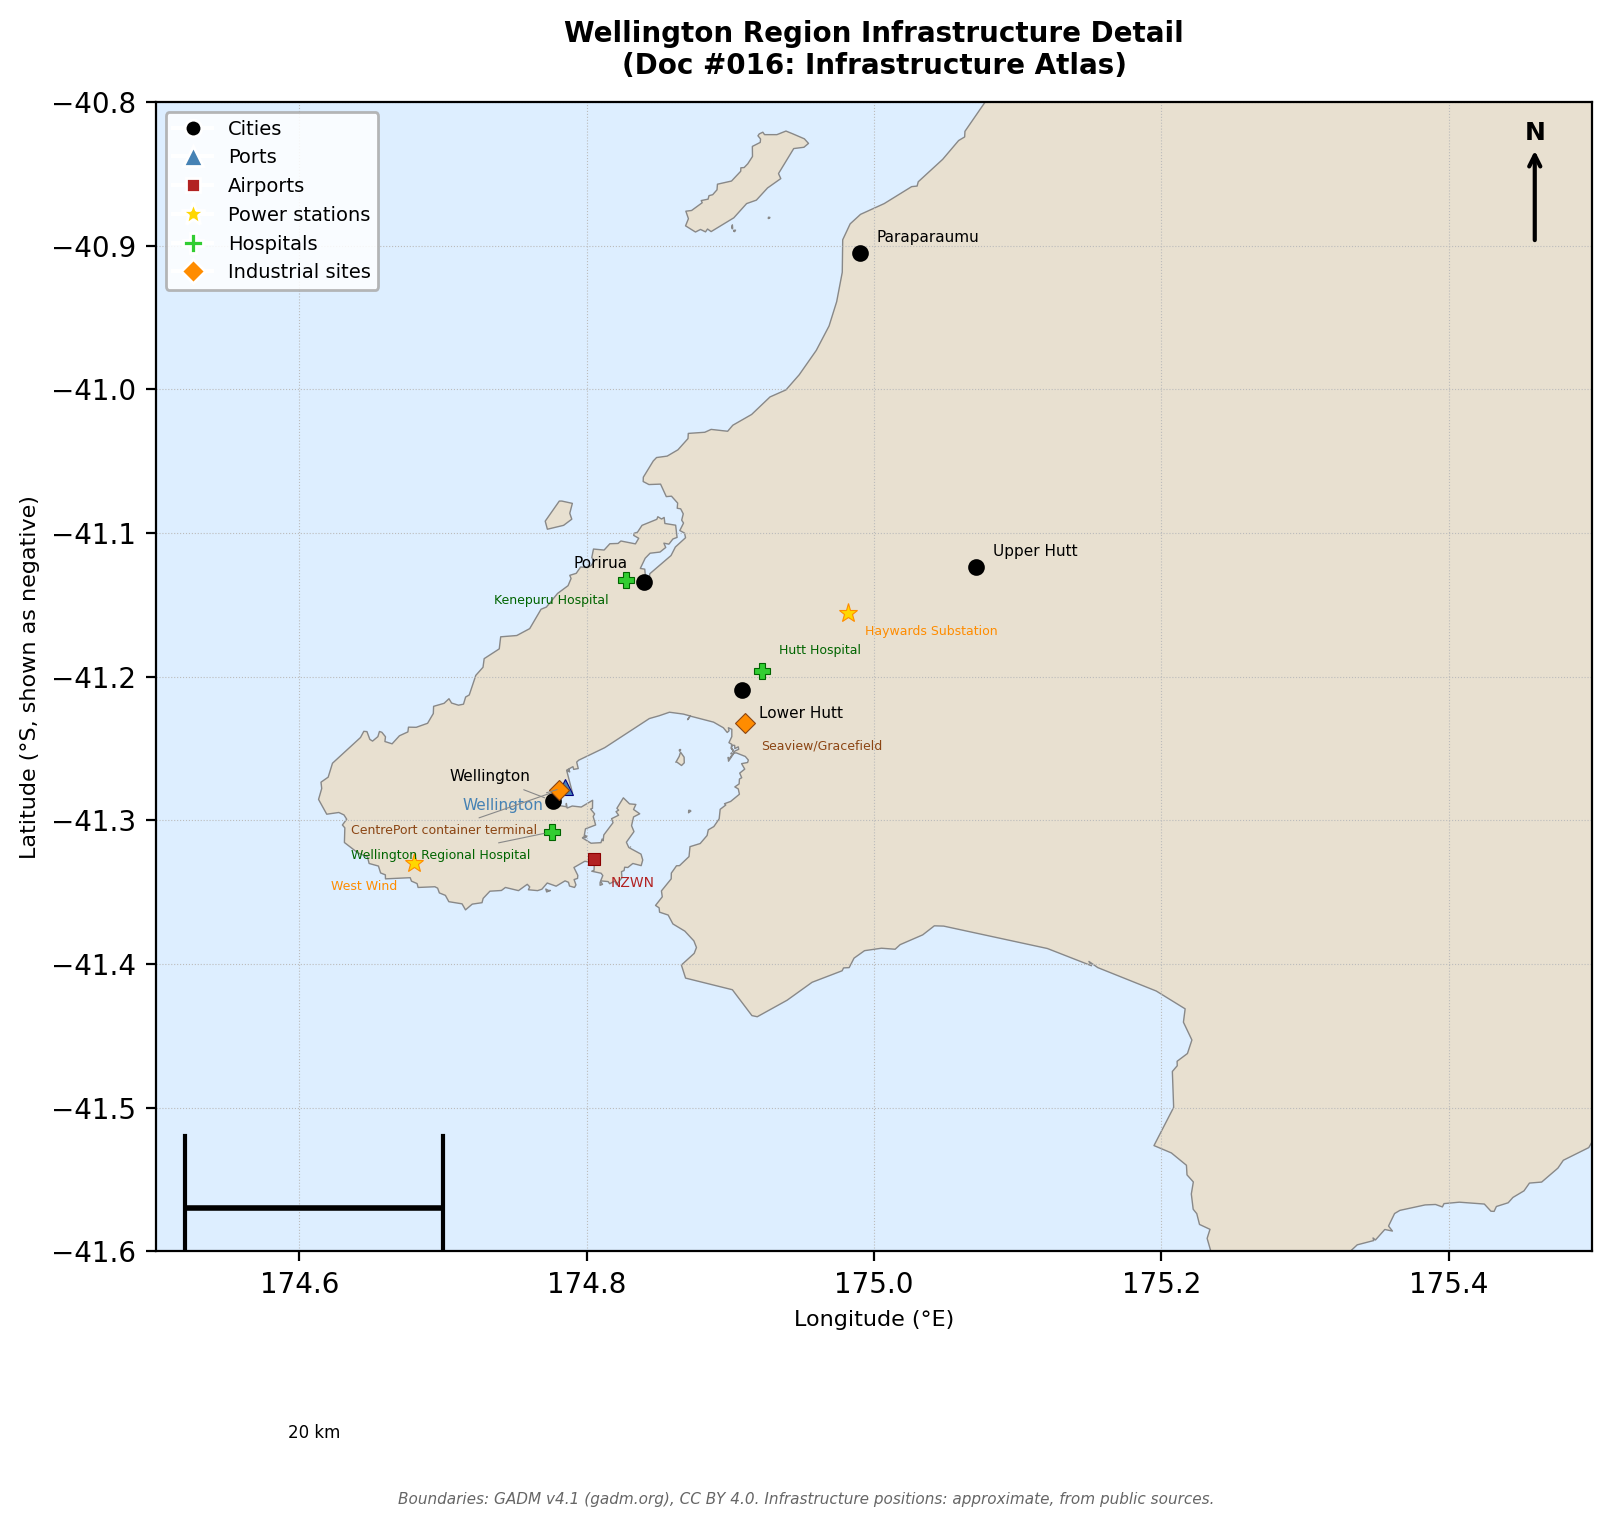
Figure 2: Wellington region infrastructure detail.