This document provides reference data for agricultural land use, soil classification, and crop production under post-disruption recovery conditions. All tables draw on pre-disruption survey data compiled by Manaaki Whenua Landcare Research and the LRIS Portal. Fertility and suitability ratings assume conventional inputs are available; see Doc #027 for organic and low-input alternatives.
1. Regional Soil Summary
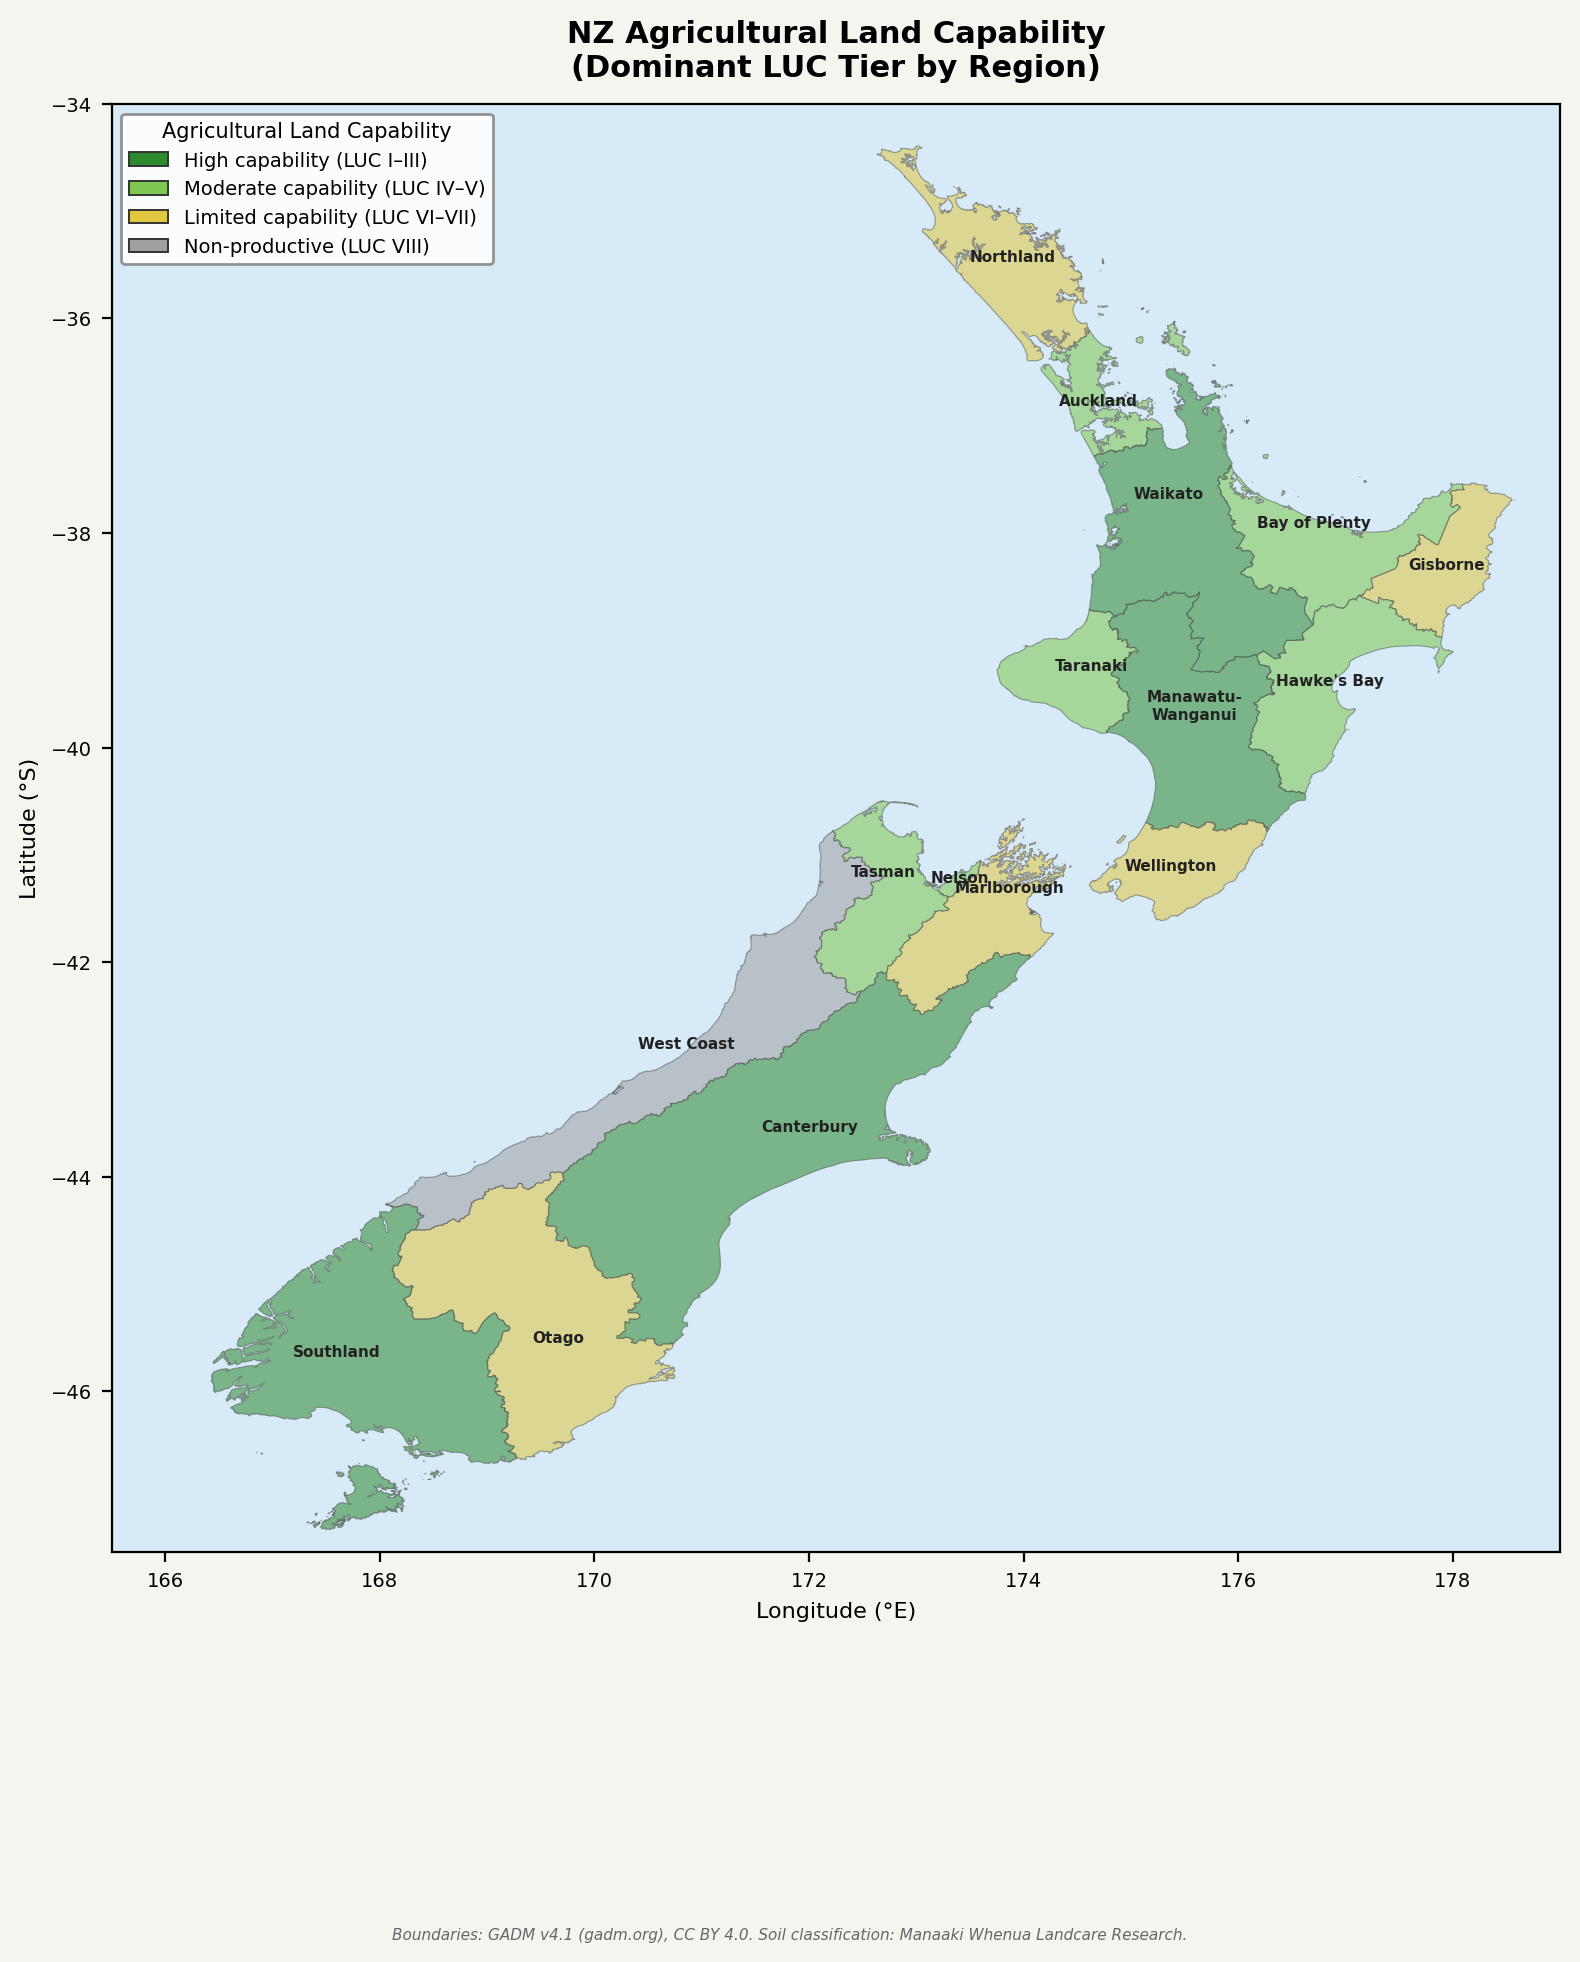
Key soil characteristics and agricultural suitability by region. LUC = Land Use Capability class (I = highest, VIII = non-productive). Fertility ratings assume standard fertiliser inputs.
| Region | Dominant NZSC Orders | LUC Classes | pH Range | Natural Fertility | Key Limitations | Best Crop Suitability |
|---|---|---|---|---|---|---|
| Northland | Brown, Allophanic, Ultic | III–V dominant, some VI–VII | 5.0–6.0 | Medium | High rainfall leaching, clay soils, rooting depth | Subtropical horticulture, avocado, kiwifruit, beef/dairy pasture |
| Auckland | Brown, Granular, Recent | II–IV dominant, urban loss | 5.5–6.5 | Medium–High | Urban pressure, clay heaviness, drainage | Market gardening, viticulture, pipfruit, dairying |
| Waikato | Allophanic, Brown, Peat/Organic | III–V dominant, peat areas VIII | 5.0–6.2 | High | Peaty areas, phosphorus retention in allophanic soils | Dairy (national core), maize silage, sheep/beef |
| Bay of Plenty | Allophanic, Pumice, Brown | III–VI mixed | 5.0–6.0 | Medium | Phosphorus fixation (pumice), low base saturation | Kiwifruit, avocado, citrus, forestry, dairy |
| Gisborne | Brown, Recent, Pallic | IV–VI dominant, erosion-prone VII | 5.8–6.8 | Medium | Erosion (East Coast), steep slopes, summer drought | Grapes, maize, sheep/beef, forestry |
| Hawke’s Bay | Pallic, Brown, Recent | I–III on plains, VI–VII hills | 6.0–7.5 | Medium–High | Summer drought, wind erosion on plains | Apples, grapes, vegetables, sheep/beef, arable |
| Taranaki | Allophanic, Brown | III–IV dominant | 5.2–6.2 | High | Phosphorus retention, wetness, steep ring plain margins | Dairy (high producing), sheep/beef, maize |
| Manawatu-Wanganui | Pallic, Brown, Recent, Allophanic | II–V plains, VI–VII ranges | 5.8–6.8 | Medium–High | Waterlogging (Pallic), ranges steep and erosion-prone | Arable (wheat, barley, maize), dairy, sheep/beef |
| Wellington | Brown, Pallic, Recent | IV–VI dominant, some II–III lowlands | 5.5–6.5 | Medium | Wind, steep terrain, summer drought | Sheep/beef, market gardens (Wairarapa), viticulture |
| Nelson-Tasman | Brown, Pallic, Recent | II–IV valleys, VI–VII hill/mountain | 5.8–7.0 | Medium | Drought risk (Nelson), steep hill terrain | Hops, apples, cherries, grapes, market vegetables |
| Canterbury | Pallic, Brown, Recent, Semi-Arid | I–III plains, VII–VIII high country | 6.0–7.5 | Medium | Frost risk, drought (Canterbury Plains), irrigation dependency | Wheat, barley, peas, brassica seeds, dairy (irrigated), sheep/beef |
| West Coast | Podzol, Brown, Gley, Organic | VI–VIII dominant, limited III–V | 4.5–5.5 | Low | Extreme rainfall, waterlogging, acidity, steep terrain | Dairy (river flats), sheep/beef (limited), forestry |
| Otago | Pallic, Brown, Semi-Arid, Gley | II–III central basin, VI–VII ranges, VIII alpine | 6.0–7.5 | Low–Medium | Frost, drought (Central Otago), erosion, cold | Stone fruit (Central), grapes, merino/sheep, arable (Maniototo) |
| Southland | Pallic, Gley, Brown, Recent | II–IV plains, VI–VII hills | 5.5–6.5 | Medium–High | Waterlogging, cold, slow mineralisation | Dairy, sheep/beef, arable (peas, cereals), fodder beet |
2. NZ Soil Classification Orders
New Zealand uses the New Zealand Soil Classification (NZSC) system with 15 soil orders. Area percentages are approximate and refer to total NZ land area including non-productive terrain.1
| Order | Description | % NZ Area | Typical Fertility | Agricultural Potential | Where Found |
|---|---|---|---|---|---|
| Allophanic | Derived from volcanic ash; amorphous allophane/imogolite clays; high P-fixation | ~9% | High (if P managed) | Good–Excellent | Waikato, Taranaki, Bay of Plenty, Central Plateau |
| Brown | Most common order; moderate weathering; range of textures; free-draining | ~28% | Medium–High | Good | Widespread: hill country, ranges, most regions |
| Gley | Seasonally or permanently waterlogged; grey/blue mottles; reducing conditions | ~8% | Low–Medium (drainage needed) | Marginal unless drained | Southland, West Coast, river flats, low-lying areas |
| Granular | Old, deeply weathered; strong angular blocky structure; high Fe/Al oxides | ~1% | Low–Medium | Moderate (horticulture) | Northern North Island (Auckland, Northland) |
| Melanic | Dark, high base saturation; well-structured; derived from base-rich parent material | ~1% | High | Excellent | Hawke’s Bay, Marlborough (limestone/basalt) |
| Organic | Peat soils; >30 cm organic matter accumulation; wet conditions | ~2% | Variable (nutrient release slow) | Poor unless drained | Waikato (Hauraki Plains), Southland, West Coast |
| Oxidic | Highly weathered; dominated by Fe/Al oxides; very old surfaces | <1% | Low | Poor | Far North (Northland relict surfaces) |
| Pallic | Pale subsoil; moderate-high base saturation; seasonally waterlogged or droughty | ~22% | Medium | Good (arable, pastoral) | Canterbury, Manawatu, Wairarapa, Southland, Otago |
| Podzol | Strong leaching; distinct E horizon; low pH; Al/Fe illuviation | ~9% | Low | Poor (forestry preferred) | West Coast, Fiordland, high-rainfall ranges |
| Pumice | From rhyolitic pumice deposits; very low bulk density; low nutrients | ~4% | Low (micronutrient deficient) | Marginal | Central Volcanic Plateau (Rotorua, Taupo area) |
| Raw | Minimal soil development; thin or absent profile; exposed rock/regolith | ~5% | None | None | Alpine areas, recent landslides, coastal dunes |
| Recent | Young soils on recent alluvium or colluvium; limited horizon development | ~7% | Medium–High | Good–Excellent (alluvial flats) | River flats nationwide: Waikato, Canterbury, Manawatu |
| Semi-Arid | Dry climate; low leaching; carbonate or salt accumulation possible | ~2% | Low–Medium | Marginal (irrigation transforms) | Central Otago, inland Marlborough |
| Ultic | Strongly leached; low base saturation; argillic horizon; acid subsoil | ~2% | Low | Poor–Marginal | Northland, parts of Auckland (old land surfaces) |
3. Land Use Capability Classes
The Land Use Capability (LUC) classification groups land into eight classes based on the degree of limitation for sustained productive use. Area figures are approximate; national coverage ~26.8 million ha total.2
| LUC Class | Description | Area (ha) | % of NZ | Suitable Uses | Limitations |
|---|---|---|---|---|---|
| I | Virtually no limitations; flat, deep, well-drained, fertile | ~260,000 | ~1% | All crops, vegetables, intensive horticulture, arable | Almost none; highest capability class |
| II | Minor limitations; slight slope, minor drainage or fertility issues | ~900,000 | ~3% | Wide range of crops, horticulture, arable, pasture | Slight: minor drainage, minor wind risk, fertility |
| III | Moderate limitations; requires careful management | ~1,800,000 | ~7% | Most crops with management, pasture, some horticulture | Moderate slope, drainage, drought or erosion risk |
| IV | Severe limitations restricting crop choice | ~2,200,000 | ~8% | Pasture, limited arable crops, perennial horticulture | Severe slope, erosion, wetness, or fertility constraints |
| V | Not suited to cultivation; few limitations on pasture/forestry | ~600,000 | ~2% | Permanent pasture, forestry, wetland conservation | Flooding, wetness; cultivation impractical |
| VI | Permanent pasture or forestry; no cultivation | ~4,500,000 | ~17% | Pastoral farming, plantation forestry, native bush | Steep slopes, erosion, climate severity |
| VII | Severe limitations even for grazing; mostly forestry/conservation | ~5,800,000 | ~22% | Extensive grazing (limited), forestry, conservation | Very steep, very severe erosion, extreme climate |
| VIII | No agricultural use; conservation, recreation, water catchment only | ~10,400,000 | ~40% | Conservation, water catchment, recreation, wilderness | Alpine, bare rock, permanent snow/ice, active erosion |
4. Fertiliser Requirements by Crop
Nutrient requirements per hectare at recommended application rates for New Zealand conditions. Ranges reflect variation by soil type, yield target, and region. N = nitrogen, P = phosphorus (as elemental P), K = potassium (as elemental K). Lime rates target indicated minimum pH.3
| Crop | N (kg/ha) | P (kg/ha) | K (kg/ha) | Lime (t/ha) | Micronutrient Needs |
|---|---|---|---|---|---|
| Wheat (grain) | 120–180 | 20–30 | 40–60 | 0–1.5 (pH 6.0+) | Mn, Cu (trace) |
| Barley (grain) | 80–120 | 18–25 | 30–50 | 0–1.0 (pH 5.8+) | Mn (occasional) |
| Potatoes | 150–220 | 35–50 | 150–200 | 1.0–2.0 (pH 5.5+) | Mg, B, Mn, Zn |
| Brassicas (veg) | 120–200 | 30–40 | 100–150 | 1.0–2.5 (pH 6.0+) | B, Mo, S |
| Dairy pasture | 150–250 | 25–40 | 60–100 | 0–2.0 (pH 5.8+) | S, Mg, Cu, Co, Se |
| Sheep/beef pasture | 0–80 | 15–30 | 30–60 | 0–1.5 (pH 5.6+) | S, Cu, Co, Se, Zn |
| Maize (grain/silage) | 150–220 | 25–40 | 80–130 | 0–1.5 (pH 5.8+) | Zn, S, Mg |
| Peas/beans (legume) | 0–20 | 20–30 | 40–70 | 0.5–2.0 (pH 6.0+) | Mo, B (rhizobium inoculant) |
5. Crop Suitability by Region
Rating key: E = Excellent (commercially viable, common practice); G = Good (viable with standard management); M = Marginal (possible in favourable years or with mitigation); U = Unsuitable (climate, soil, or topography prohibitive).
Ratings assume adequate rainfall or irrigation where required. Dairying rating reflects pasture production capacity rather than enterprise economics. Ratings follow regional best-practice benchmarks.4
| Region | Wheat | Barley | Potatoes | Brassicas | Maize | Peas/Beans | Apples/Pipfruit | Grapes/Wine | Dairying | Sheep/Beef |
|---|---|---|---|---|---|---|---|---|---|---|
| Northland | U | U | M | G | G | M | M | M | G | G |
| Auckland | U | U | G | G | G | M | G | G | G | G |
| Waikato | M | M | G | G | E | M | M | M | E | G |
| Bay of Plenty | U | U | M | G | G | M | G | M | G | G |
| Gisborne | G | G | M | G | G | M | M | G | M | G |
| Hawke’s Bay | G | G | G | G | G | G | E | E | M | G |
| Taranaki | M | M | G | G | G | M | M | U | E | G |
| Manawatu-Wanganui | E | G | G | G | E | G | G | M | G | G |
| Wellington | M | M | M | G | M | G | M | G | M | G |
| Nelson-Tasman | M | M | G | G | M | G | E | G | M | G |
| Canterbury | E | E | G | E | G | E | G | G | G | G |
| West Coast | U | U | M | M | U | U | U | U | M | M |
| Otago | G | G | M | G | M | G | E | E | M | G |
| Southland | G | G | G | G | M | G | M | M | E | E |
Sources and Notes
Soil classification data: Hewitt, A.E. (2010). New Zealand Soil Classification, 3rd edition. Manaaki Whenua — Landcare Research Science Series No. 1. Lincoln, NZ.
Land Use Capability: Lynn, I.H., Manderson, A.K., Page, M.J., Harmsworth, G.R., Eyles, G.O., Douglas, G.B., Mackay, A.D., Newsome, P.F.J. (2009). Land Use Capability Survey Handbook: A New Zealand Handbook for the Classification of Land. 3rd ed. AgResearch / Landcare Research / Environment Canterbury.
Regional soil mapping: S-map Online (smap.landcareresearch.co.nz), Manaaki Whenua — Landcare Research. National soil map database.
LRIS Portal: Land Resource Information Systems Portal (lris.scinfo.org.nz), Manaaki Whenua — Landcare Research. Accessed 2024.
Fertiliser guidance: Fertiliser Association of New Zealand (Fertmark); Edmeades, D.C. & Metherell, A.K. (2004). The Relationships between Soil Tests, Fertiliser Inputs and Pasture Production in NZ. NZ Grassland Association.
Production statistics: Ministry for Primary Industries / Statistics New Zealand. Agricultural Production Statistics 2022–2023. Wellington, NZ.
This document is part of the Recovery Library, a reference collection for post-disruption resource recovery. Data reflects pre-disruption conditions as a baseline. Soil properties and fertility responses under disrupted supply chains (reduced fertiliser, equipment loss) are addressed in companion documents.
Hewitt, A.E. (2010). New Zealand Soil Classification. 3rd ed. Manaaki Whenua Press.↩︎
Lynn, I.H. et al. (2009). Land Use Capability Survey Handbook. 3rd ed. Manaaki Whenua Press / AgResearch / Environment Canterbury.↩︎
Fertiliser Association of New Zealand. Nutrient Management Guidelines. Current ed. See also: Edmeades, D.C. & Metherell, A.K. (2004). Nitrogen and Phosphorus in New Zealand Soils. NZGA.↩︎
MPI. (2023). Agricultural Production Statistics. Statistics New Zealand. S-map Online, LRIS Portal, Manaaki Whenua.↩︎