Water Resources — Data Tables
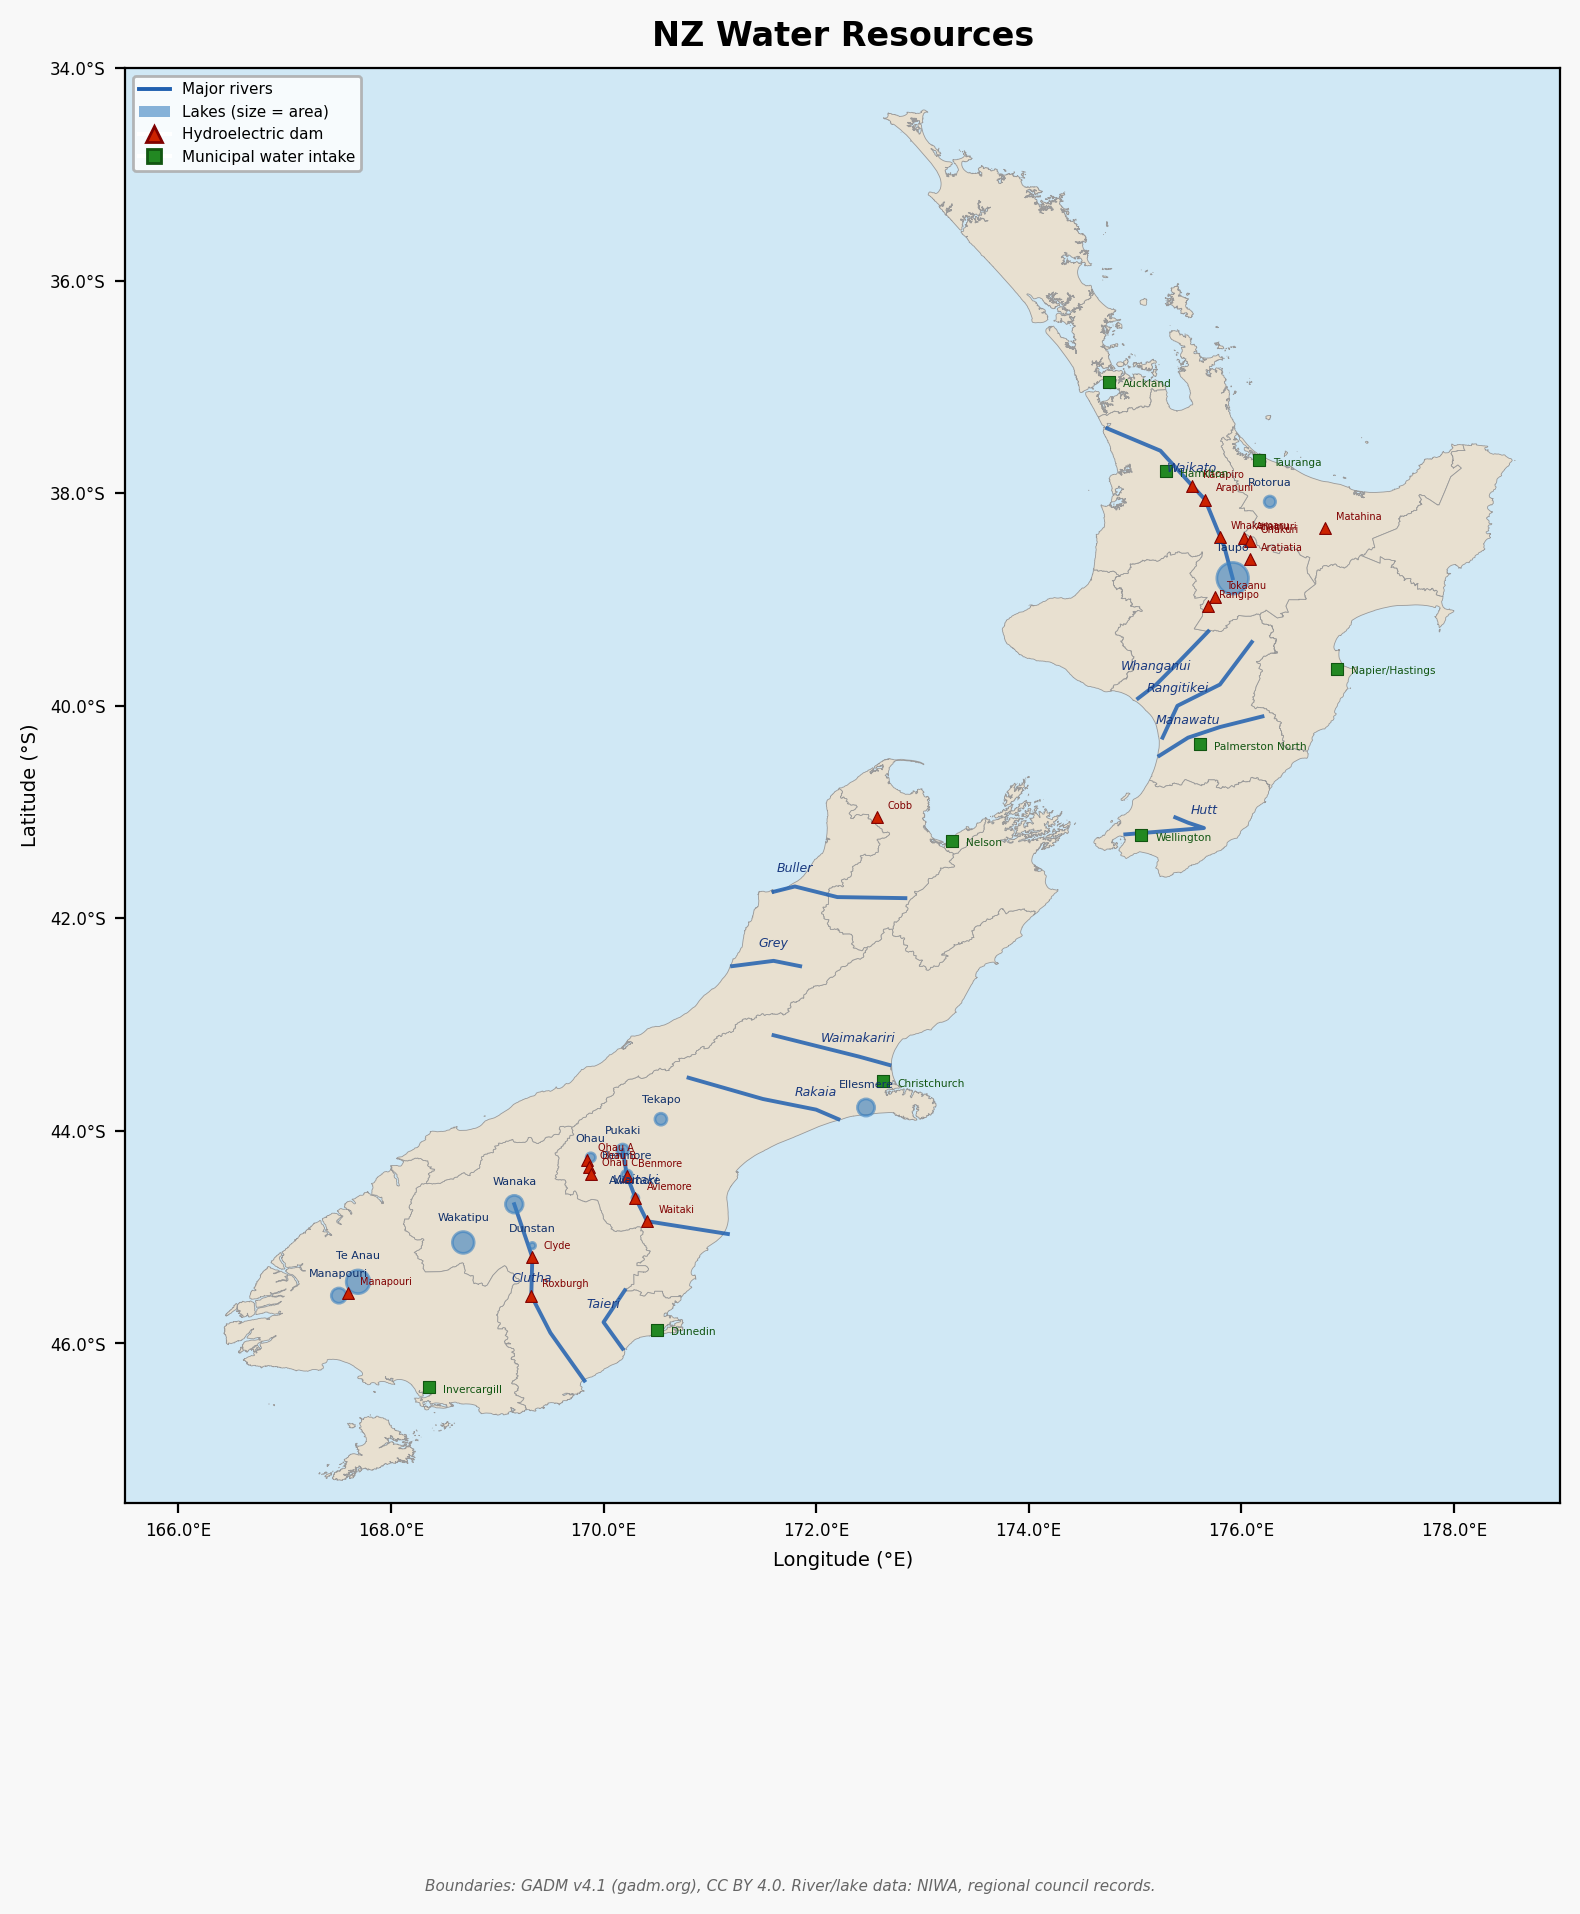
Figure 1: Major rivers (blue lines), lakes (blue circles scaled by area), hydroelectric dams (red triangles), and principal municipal water intakes (green squares). Source data: NIWA River Environment Classification; regional council GIS layers.
1. Major Rivers
Data sources: NIWA River Environment Classification (REC2); Land Cover Database; regional council annual river flow reports.1
| River | Length (km) | Mean Flow (m³/s) | Catchment (km²) | Source | Mouth (approx. coordinates) | Water Quality | Primary Uses | Flood Risk |
|---|---|---|---|---|---|---|---|---|
| Waikato | 425 | 360 | 14137 | Lake Taupo | Port Waikato, 37.39°S 174.74°E | Good (treated) | Hydro, irrigation, municipal, recreation | High — lower reaches flood-prone |
| Clutha | 322 | 614 | 21000 | Lakes Wanaka/Hawea | Molyneux Bay, 46.35°S 169.82°E | Good | Hydro (Clyde, Roxburgh), irrigation | Moderate — managed by dams |
| Whanganui | 290 | 94 | 7380 | Tongariro/Ruapehu slopes | Whanganui city, 39.93°S 175.03°E | Good | Recreation, cultural, some irrigation | High — gorge-fed, rapid rises |
| Rangitikei | 241 | 93 | 3764 | Kaimanawa Ranges | Tangimoana, 40.30°S 175.26°E | Good | Irrigation, hydro (Mangahao), municipal | Moderate |
| Manawatu | 182 | 97 | 5890 | Hawke’s Bay hill country | Foxton Beach, 40.47°S 175.23°E | Fair (elevated nitrate) | Irrigation, municipal (Palmerston North) | High — gorge acts as bottleneck |
| Waitaki | 209 | 348 | 11612 | Lake Ohau/Pukaki/Tekapo | Waitaki mouth, 44.97°S 171.17°E | Excellent | Hydro (Waitaki scheme), irrigation | Low — heavily regulated |
| Rakaia | 145 | 207 | 3057 | Southern Alps/Rakaia Glacier | Rakaia lagoon, 43.89°S 172.21°E | Excellent | Irrigation (Canterbury Plains), salmon fishery | High — braided, rapid flooding |
| Waimakariri | 161 | 120 | 3613 | Southern Alps | Kaiapoi, 43.38°S 172.69°E | Excellent | Municipal (Christchurch artesian recharge), irrigation | High — braided |
| Hutt | 56 | 24 | 650 | Tararua Ranges | Wellington Harbour, 41.21°S 174.91°E | Good | Municipal (Wellington), recreation | High — urban channel, flash flooding |
| Buller | 169 | 375 | 6500 | Lake Rotoiti (Nelson Lakes) | Westport, 41.75°S 171.60°E | Excellent | Hydro (potential), recreation | High — steep catchment |
| Grey | 121 | 235 | 3876 | Lewis Pass area | Greymouth, 42.45°S 171.21°E | Good | Historic alluvial gold mining, recreation | High — West Coast deluges |
| Mokau | 158 | 44 | 2720 | King Country ranges | Mokau, 38.70°S 174.62°E | Good | Minor irrigation, recreation | Moderate |
| Taieri | 288 | 40 | 5764 | Lammermoor/Rock and Pillar Ranges | Taieri mouth, 46.05°S 170.18°E | Good | Irrigation (Strath Taieri), some hydro | Moderate |
| Mataura | 240 | 71 | 5765 | Eyre Mountains | Fortrose, 46.56°S 168.79°E | Fair | Irrigation, recreational trout fishery | Moderate |
| Clutha-Matau | 30 | 614 | 400 | Clyde Dam tailrace | Clutha mouth (combined) | Good | Navigation, recreation | Low — regulated |
2. Major Lakes
Data sources: NIWA Lakes380 database; Land Information New Zealand (LINZ) bathymetry surveys; Meridian/Contact/Genesis Energy reservoir data.2
| Lake | Area (km²) | Max Depth (m) | Volume (km³) | Longitude | Latitude | Type | Water Quality | Primary Uses |
|---|---|---|---|---|---|---|---|---|
| Taupo | 616 | 186 | 59.0 | 175.92°E | 38.80°S | Natural (volcanic) | Excellent — oligotrophic | Hydro regulation, recreation, trophy trout fishery |
| Wakatipu | 291 | 380 | 35.2 | 168.68°E | 45.05°S | Natural (glacial) | Excellent | Recreation, tourism, minor municipal |
| Te Anau | 344 | 417 | 59.1 | 167.69°E | 45.42°S | Natural (glacial) | Excellent | Manapouri hydro regulation, tourism |
| Wanaka | 192 | 311 | 29.8 | 169.16°E | 44.69°S | Natural (glacial) | Excellent | Recreation, Clutha headwaters |
| Manapouri | 142 | 444 | 21.8 | 167.51°E | 45.55°S | Natural (glacial) | Excellent | Manapouri power station (800 MW) |
| Rotorua | 80 | 45 | 2.5 | 176.27°E | 38.08°S | Natural (volcanic) | Good (geothermal inputs) | Tourism, recreation, cultural (Maori) |
| Ellesmere | 181 | 2 | 0.4 | 172.47°E | 43.78°S | Natural (coastal lagoon) | Fair (nutrient-enriched) | Wildlife habitat, occasional outlet to sea |
| Pukaki | 87 | 100 | 5.3 | 170.18°E | 44.18°S | Artificial (reservoir) | Excellent | Hydro (Ohau/Tekapo schemes), tourism |
| Ohau | 53 | 94 | 2.8 | 169.88°E | 44.25°S | Natural (glacial, modified) | Excellent | Ohau A/B/C hydro stations |
| Tekapo | 88 | 93 | 5.4 | 170.54°E | 43.89°S | Natural (glacial, modified) | Excellent | Tekapo hydro, tourism (dark sky reserve) |
| Benmore | 75 | 90 | 2.4 | 170.22°E | 44.42°S | Artificial (reservoir) | Good | Benmore 540 MW hydro station |
| Aviemore | 29 | 45 | 0.6 | 170.30°E | 44.63°S | Artificial (reservoir) | Good | Aviemore 220 MW hydro station |
| Dunstan | 26 | 54 | 0.8 | 169.33°E | 45.08°S | Artificial (reservoir) | Good | Clyde 432 MW hydro station |
3. Hydroelectric Dams
Data sources: Meridian Energy, Contact Energy, Genesis Energy annual reports; Electricity Authority generation data; Ministry of Business, Innovation and Employment (MBIE) energy statistics.3
| Dam | River | Longitude | Latitude | Capacity (MW) | Reservoir/Lake | Annual Generation (GWh) | Operator |
|---|---|---|---|---|---|---|---|
| Manapouri | Waiau | 167.60°E | 45.53°S | 800 | Lake Manapouri | 5800 | Meridian Energy |
| Clyde | Clutha | 169.33°E | 45.19°S | 432 | Lake Dunstan | 2000 | Contact Energy |
| Benmore | Waitaki | 170.22°E | 44.42°S | 540 | Lake Benmore | 2200 | Meridian Energy |
| Aviemore | Waitaki | 170.30°E | 44.63°S | 220 | Lake Aviemore | 900 | Meridian Energy |
| Waitaki | Waitaki | 170.41°E | 44.85°S | 105 | Run-of-river | 540 | Meridian Energy |
| Ohau A | Ohau Canal | 169.84°E | 44.27°S | 264 | Lake Ohau | 1250 | Meridian Energy |
| Ohau B | Ohau Canal | 169.86°E | 44.34°S | 212 | Lake Ohau | 1000 | Meridian Energy |
| Ohau C | Ohau Canal | 169.88°E | 44.41°S | 212 | Lake Ohau | 1000 | Meridian Energy |
| Roxburgh | Clutha | 169.32°E | 45.55°S | 320 | Lake Roxburgh | 1250 | Contact Energy |
| Arapuni | Waikato | 175.66°E | 38.06°S | 196 | Lake Arapuni | 900 | Genesis Energy |
| Karapiro | Waikato | 175.54°E | 37.93°S | 100 | Lake Karapiro | 450 | Genesis Energy |
| Whakamaru | Waikato | 175.80°E | 38.41°S | 100 | Lake Whakamaru | 580 | Genesis Energy |
| Atiamuri | Waikato | 176.03°E | 38.42°S | 84 | Lake Atiamuri | 440 | Genesis Energy |
| Ohakuri | Waikato | 176.08°E | 38.45°S | 112 | Lake Ohakuri | 560 | Genesis Energy |
| Aratiatia | Waikato | 176.08°E | 38.62°S | 90 | Aratiatia Reservoir | 430 | Genesis Energy |
| Tokaanu | Tokaanu | 175.75°E | 38.98°S | 240 | Lake Taupo | 1100 | Genesis Energy |
| Rangipo | Tongariro | 175.69°E | 39.06°S | 120 | Lake Rotoaira | 590 | Genesis Energy |
| Matahina | Rangitaiki | 176.79°E | 38.33°S | 72 | Lake Matahina | 305 | Bay of Plenty RC |
| Cobb | Cobb | 172.57°E | 41.05°S | 31 | Cobb Reservoir | 131 | TrustPower |
Totals listed above: 4,250 MW installed capacity; ~21,426 GWh annual generation (varies with hydrology). NZ total hydro capacity ~5,600 MW, generating approximately 23,000–25,000 GWh/yr (~57% of national electricity).4
4. Municipal Water Sources
Data sources: Taumata Arowai (Water Services Regulator) drinking water register; local authority annual reports; Three Waters review documentation.5
| City / Urban Area | Primary Source | Backup Source | Treatment | Capacity (ML/day) | Population Served | Vulnerability Assessment |
|---|---|---|---|---|---|---|
| Auckland | Hunua Ranges dams (Mangatangi, Mangatawhiri, Waitakere Ranges dams) | Waikato River (Tuakau intake) | Conventional + UV + chloramine | 600 | 1,700,000 | Low-moderate — large storage; Waikato backup requires treatment upgrade |
| Wellington | Wainuiomata Reservoir; Hutt River (Te Marua) | Waterloo groundwater | Conventional + UV + chlorine | 200 | 430,000 | Moderate — aging infrastructure; fault-crossing mains (seismic risk) |
| Christchurch | Canterbury artesian wells (200+ bores) | Waimakariri River (emergency) | Chlorination only (naturally filtered) | 340 | 390,000 | Low under normal conditions; earthquake risk to well infrastructure |
| Hamilton | Waikato River (Waterworks Road intake) | Pukete groundwater | Conventional + UV + chlorine | 150 | 180,000 | Moderate — dependent on Waikato water quality; algal bloom risk |
| Tauranga | Wairoa River; Welcome Bay groundwater | Waimapu Stream | Conventional + UV + chlorine | 80 | 160,000 | Moderate — summer low-flow constraints |
| Dunedin | Deep Stream Reservoir (Ross Creek); Waipori scheme | Deep Creek | Conventional + UV + chlorine | 60 | 130,000 | Low — high-elevation gravity-fed reservoirs; drought risk increasing |
| Napier/Hastings | Heretaunga Plains artesian aquifer | Ngaruroro River (flood prone) | Chlorination | 70 | 140,000 | High — aquifer nitrate contamination; seismic disruption risk |
| Palmerston North | Manawatu River (Turitea intake) | Pohangina groundwater | Conventional + UV + chlorine | 55 | 90,000 | Moderate — Manawatu water quality concerns (E. coli, nitrate) |
| Nelson | Maitai Dam; Lee Valley intake | Roding River | Conventional + UV + chlorine | 30 | 55,000 | Low — good highland supply; fire risk in summer |
| Invercargill | Oreti River / Sandy Point wellfield | Waihopai groundwater | Conventional + chlorine | 40 | 60,000 | Low — abundant Southland rainfall |
Note on infrastructure damage scenarios: Christchurch’s artesian supply is highly resilient to surface contamination but vulnerable to earthquake-induced liquefaction damaging wellheads and mains (as demonstrated in 2011). Wellington’s cross-fault mains present the most acute seismic risk nationally — a major Wellington Fault rupture could isolate supply for weeks.6
5. Major Aquifers
Data sources: GNS Science groundwater databases; regional council allocation registers; MfE National Policy Statement for Freshwater Management 2020.7
| Aquifer | Region | Type | Area (km²) | Recharge Rate | Current Allocation | Water Quality |
|---|---|---|---|---|---|---|
| Canterbury Plains | Canterbury | Unconfined (multi-layer) | 11000 | Variable 200–800 mm/yr (alpine rivers) | ~60% (irrigation dominant) | Generally good; nitrate elevated in intensively farmed zones (up to 12 mg/L NO3-N) |
| Heretaunga Plains | Hawke’s Bay | Confined & unconfined | 1100 | Ngaruroro/Tukituki rivers + direct recharge | Over-allocated in parts | Nitrate concerns in shallow unconfined; deep confined layers high quality |
| Manawatu | Manawatu-Whanganui | Unconfined (fluvial) | 800 | Manawatu/Oroua rivers | ~40% | Moderate; E. coli risk near surface; some nitrate elevation |
| Hauraki Plains | Waikato | Unconfined (peat/alluvial) | 560 | Waihou/Piako rivers + rainfall | ~30% | Iron/manganese elevated; some turbidity; good for irrigation with treatment |
| Waimea Plains | Nelson/Tasman | Unconfined (alluvial) | 200 | Waimea/Wai-iti rivers | ~55% (summer peak) | Good quality; seasonal stress; Waimea Community Dam added 2023 |
| Southland Plains | Southland | Unconfined (glacial outwash) | 4200 | Rainfall + Oreti/Aparima rivers | ~25% | Good generally; nitrate rising in dairying zones; high natural recharge |
Allocation note: Several Canterbury sub-catchments and the Heretaunga Plains are in allocation limit or over-allocation status under the NPS-FM 2020 framework. Aquifer recharge rates in rain-fed systems (Southland, Waikato) are relatively secure under climate projections; rain-shadow Canterbury aquifers recharged by alpine rivers face risk if glacier retreat reduces late-summer flows.8
6. Water Budget Summary by Region
Data sources: NIWA Regional Climate Projections; Statistics New Zealand regional population estimates 2024; MfE Environmental Indicators.9
| Region | Area (km²) | Mean Precip. (mm/yr) | Mean Runoff (mm/yr) | Population (approx.) | Per-Capita Availability (m³/yr) | Key Constraints |
|---|---|---|---|---|---|---|
| Northland | 13,941 | 1600 | 900 | 195,000 | 640,000 | Seasonal drought risk; groundwater quality variable |
| Auckland | 5,600 | 1200 | 550 | 1,700,000 | 18,000 | Storage-limited; Waikato backup adds resilience |
| Waikato | 25,598 | 1300 | 650 | 490,000 | 330,000 | River-dependent; algal blooms restrict summer supply |
| Bay of Plenty | 5,432 | 1600 | 850 | 350,000 | 132,000 | Abundant but local distribution challenges |
| Hawke’s Bay | 14,164 | 800 | 380 | 180,000 | 300,000 | Water-stressed summers; aquifer nitrate rising |
| Manawatu-Whanganui | 22,220 | 1100 | 600 | 250,000 | 533,000 | Adequate volume; water quality primary concern |
| Wellington | 8,124 | 1150 | 600 | 440,000 | 113,000 | Storage adequate; seismic vulnerability of infrastructure |
| Tasman/Nelson | 9,616 | 1000 | 550 | 115,000 | 459,000 | Good supply; summer demand pressure |
| Canterbury | 44,504 | 700 | 350 | 580,000 | 268,000 | Abundant alpine water; distribution across plains energy-intensive |
| Otago | 31,186 | 700 | 400 | 230,000 | 541,000 | Excellent — glacial lakes and rivers; rural distribution sparse |
| Southland | 28,174 | 1100 | 700 | 100,000 | 1,966,000 | Most water-abundant region per capita in NZ |
Interpretation
New Zealand’s national per-capita freshwater availability (~84,000 m³/person/year) is among the highest in the world. The binding constraint in most scenarios is not volume but access: infrastructure condition, contamination, and distribution energy requirements.
In a grid-off or infrastructure-damage scenario:
- Gravity-fed highland supplies (Dunedin, Nelson, most alpine communities) are most resilient — flow continues without pumping.
- Artesian supplies (Christchurch) flow under natural pressure but require intact wellhead and distribution infrastructure.
- River intakes requiring treatment (Hamilton, Palmerston North, Auckland’s Waikato backup) depend on powered treatment plants; raw Waikato River water carries Giardia, cyanotoxin, and turbidity risks.
- Canterbury Plains irrigation relies on electricity for pump-lift; gravity-canal schemes (Rakaia-Selwyn Irrigation, Central Plains Water) are more resilient.
- Minimum survival requirement is approximately 5 L/person/day for drinking; 50 L/day supports basic sanitation. Most NZ stream sources, filtered and treated with household-scale methods (Sawyer PointOne, boiling, UV), can meet survival needs within walking distance of most settlements.10
NIWA, River Environment Classification New Zealand (REC2), 2010–2022; NIWA flow data portal (https://niwa.co.nz/freshwater); Regional council (Environment Canterbury, Horizons, Greater Wellington) annual river flow reports.↩︎
NIWA, Lakes380 Project, Waikato University / NIWA, 2021; LINZ bathymetric surveys; Meridian Energy, Contact Energy, Genesis Energy annual reports 2022–2024.↩︎
MBIE, New Zealand Energy Data File 2024; Electricity Authority, Generation Data (EMI portal); Meridian Energy, Contact Energy, Genesis Energy statutory disclosures.↩︎
MBIE, New Zealand Energy Data File 2024; Electricity Authority, Generation Data (EMI portal); Meridian Energy, Contact Energy, Genesis Energy statutory disclosures.↩︎
Taumata Arowai, Drinking Water Quality Register, 2024; GNS Science, Active Fault Database (seismic risk assessments); Wellington Water Ltd, Infrastructure Strategy 2024–2054; Christchurch City Council, Water Supply Strategy 2023.↩︎
Taumata Arowai, Drinking Water Quality Register, 2024; GNS Science, Active Fault Database (seismic risk assessments); Wellington Water Ltd, Infrastructure Strategy 2024–2054; Christchurch City Council, Water Supply Strategy 2023.↩︎
GNS Science, Groundwater Resources of New Zealand, 2015; MfE, National Policy Statement for Freshwater Management 2020; Environment Canterbury, Water Allocation Data 2023; Hawke’s Bay Regional Council, Heretaunga Plains Aquifer Review 2022.↩︎
GNS Science, Groundwater Resources of New Zealand, 2015; MfE, National Policy Statement for Freshwater Management 2020; Environment Canterbury, Water Allocation Data 2023; Hawke’s Bay Regional Council, Heretaunga Plains Aquifer Review 2022.↩︎
NIWA, The New Zealand Hydrological Cycle, 2019; MfE, Environmental Indicators — Fresh water, 2022; Statistics NZ, Subnational Population Estimates, 2024; WHO, Minimum Water Requirements in Emergencies, 2011.↩︎
NIWA, The New Zealand Hydrological Cycle, 2019; MfE, Environmental Indicators — Fresh water, 2022; Statistics NZ, Subnational Population Estimates, 2024; WHO, Minimum Water Requirements in Emergencies, 2011.↩︎