This Python script generates the Fauna Reference tables used by Doc #025 (Fauna Reference). It produces six structured reference tables covering New Zealand’s animal protein resources: domestic livestock baseline with herd sizes and vulnerability ratings; wild game species with sustainable harvest estimates; marine fisheries with commercial catch data and protein yields; freshwater species including trout, eels, and whitebait; pest species with food or fur value; and a protein yield summary modelling a 12-month disrupted-supply scenario for a population of 5 million.
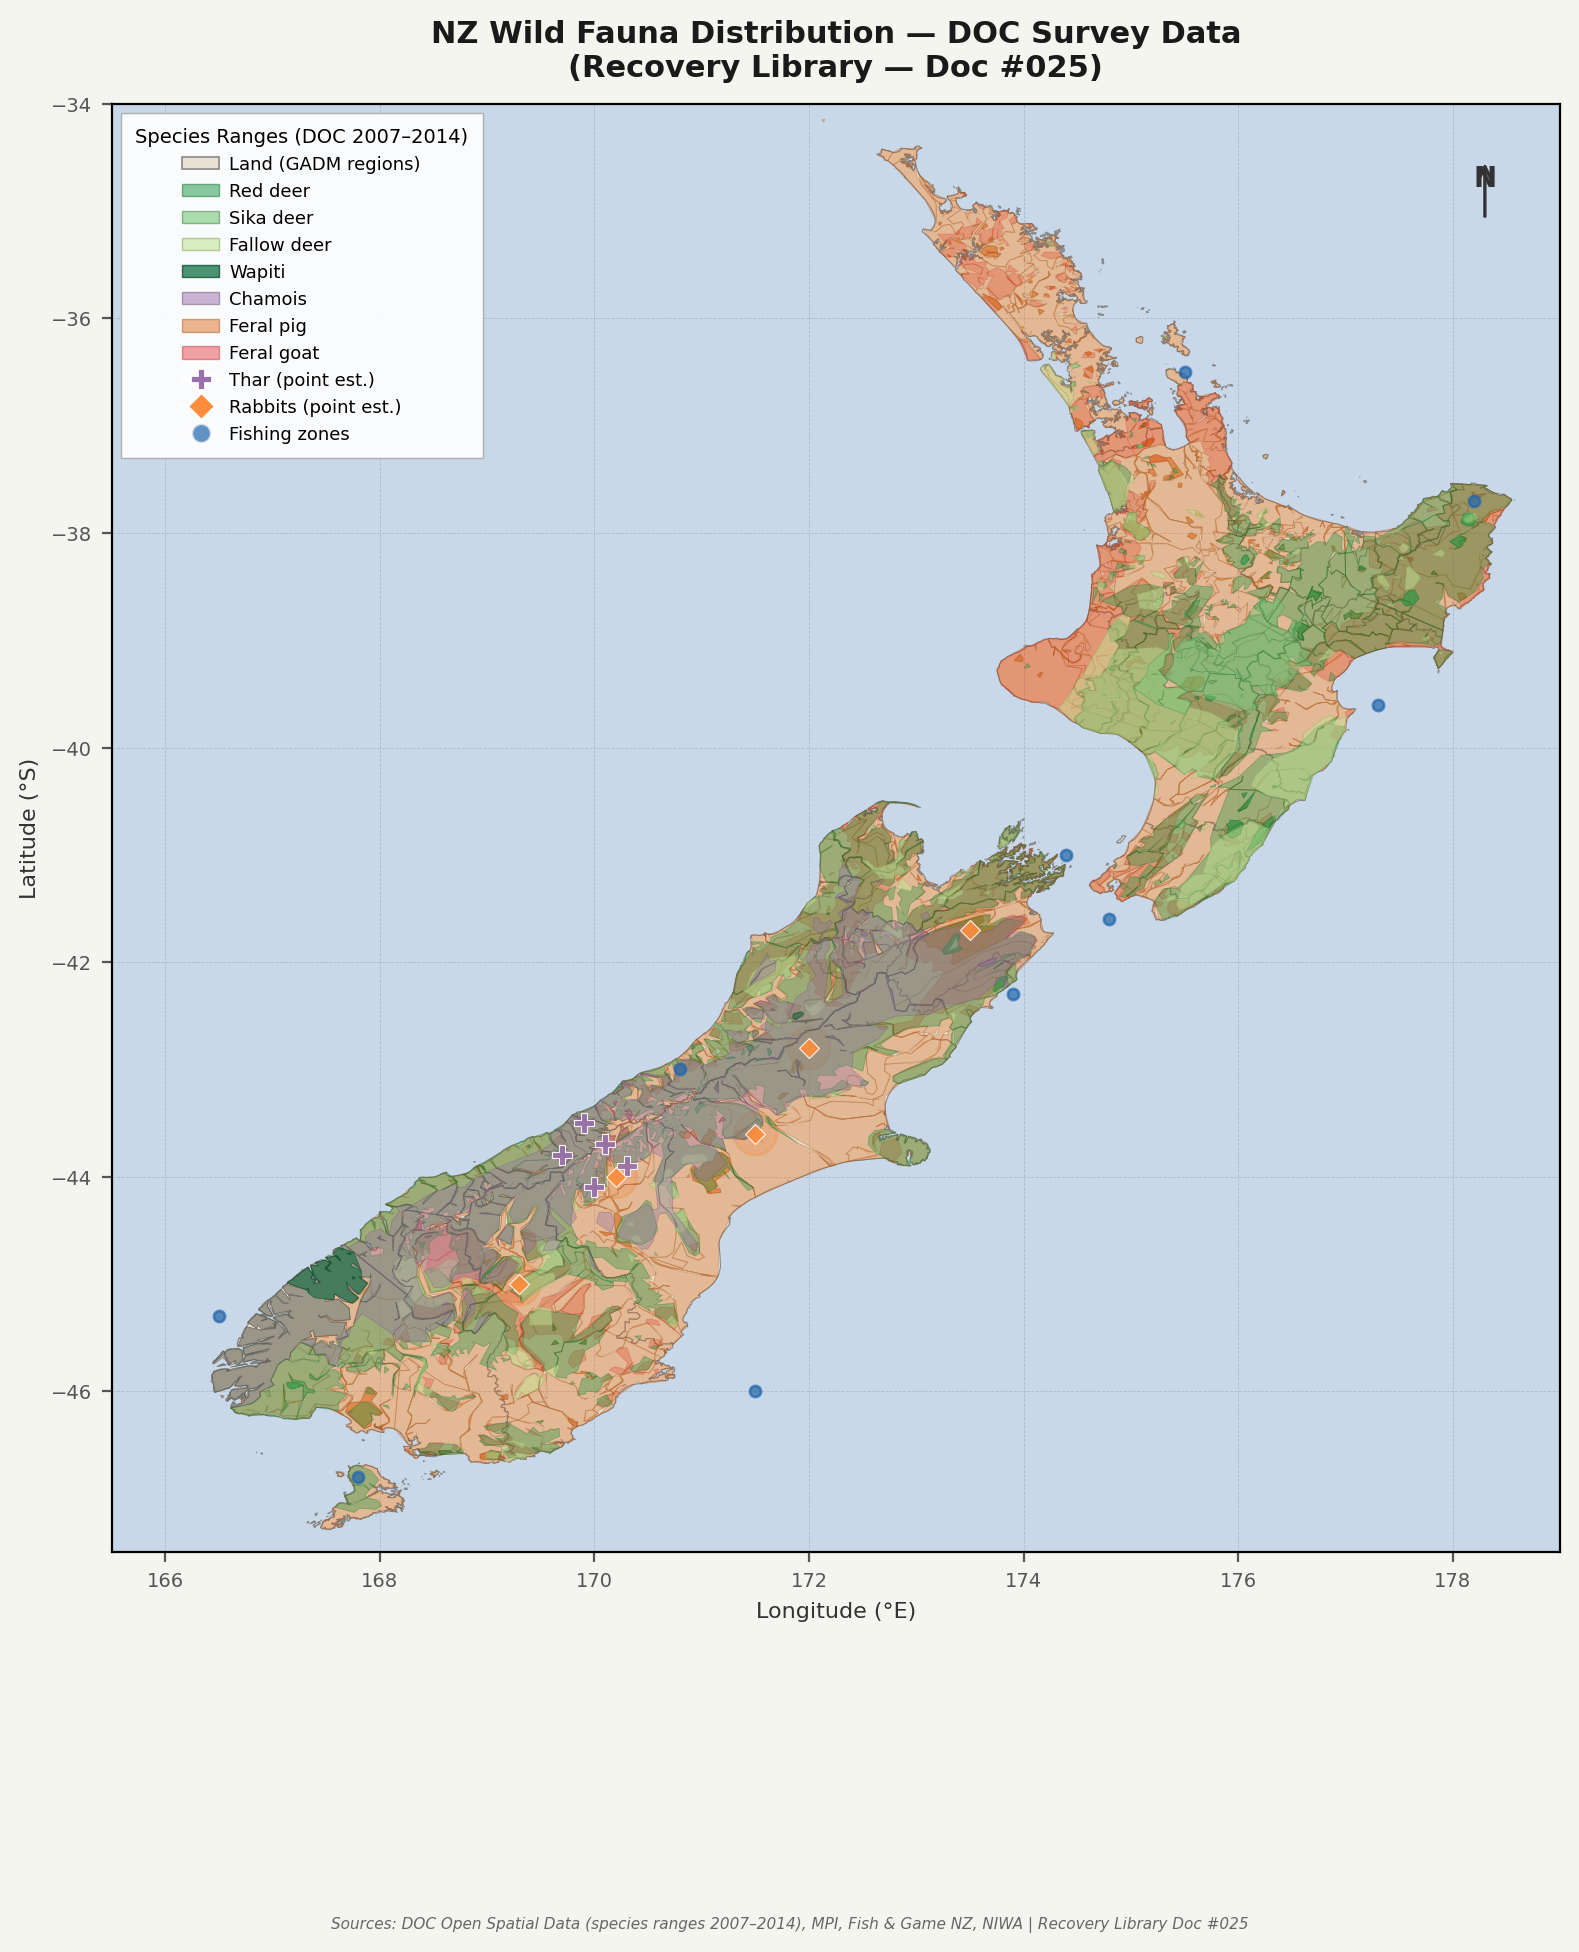
The distribution map renders real DOC (Department of Conservation) species range polygons from surveys conducted 2007–2014, covering 7 game species (red deer, sika deer, fallow deer, wapiti, chamois, feral pig, feral goat). These are actual survey-derived boundaries, not point estimates. Thar, rabbits, and fishing zones are shown as point markers where polygon data is not available. Land boundaries use GADM v4.1 administrative regions.
Requirements: Python 3.6+ with matplotlib,
numpy. Also requires: -
scripts/data/gadm41_NZL_1.json — GADM v4.1 NZ
regional boundaries (included in repository) -
scripts/data/doc-*.geojson — 7 DOC species
distribution files (simplified from original survey data,
reprojected from NZTM2000 to WGS84; included in repository)
Usage:
python scripts/generate_fauna_reference.py
# Default output: tables-fauna.md + site/images/fauna-distribution.png
Output: - tables-fauna.md — six
tables with footnotes covering livestock, wild game, marine
species, freshwater species, pest species with food value, and a
protein yield summary -
site/images/fauna-distribution.png — NZ wild fauna
distribution map with DOC survey polygons for 7 species, plus
point markers for thar, rabbits, and fishing zones
DOC Species Data Files:
| File | Species | Features | Survey Year |
|---|---|---|---|
doc-red-deer.geojson |
Red deer (Cervus elaphus) | 216 MultiPolygon | 2007 |
doc-feral-pig.geojson |
Feral pig (Sus scrofa) | 348 MultiPolygon | 2007 |
doc-feral-goat.geojson |
Feral goat (Capra hircus) | 239 MultiPolygon | 2014 |
doc-chamois.geojson |
Chamois (Rupicapra rupicapra) | 37 MultiPolygon | 2007 |
doc-sika-deer.geojson |
Sika deer (Cervus nippon) | 20 Polygon | 2007 |
doc-fallow-deer.geojson |
Fallow deer (Dama dama) | 107 MultiPolygon | 2007 |
doc-wapiti.geojson |
Wapiti (Cervus canadensis) | 2 Polygon | 2007 |
Original DOC survey data was in NZTM2000 (EPSG:2193) projection at parcel-level detail (~200 MB total). Files were simplified using Douglas-Peucker at 2 km resolution and reprojected to WGS84, yielding ~550 KB total — suitable for atlas-scale rendering.
Source Code
#!/usr/bin/env python3
"""
generate_fauna_reference.py
Generates tables-fauna.md and fauna-distribution.png for the Recovery Library.
Doc #025: Fauna Reference — NZ livestock, wild game, marine, and freshwater species.
Uses real DOC (Department of Conservation) species distribution survey polygons
for 7 game species, supplemented with point markers for thar, rabbits, and
fishing zones where polygon data is not available.
Run with:
scripts/.venv/bin/python generate_fauna_reference.py
Outputs:
../tables-fauna.md
../site/images/fauna-distribution.png
"""
import json
import os
import sys
from pathlib import Path
import matplotlib
matplotlib.use("Agg")
import matplotlib.pyplot as plt
import matplotlib.patches as mpatches
from matplotlib.patches import Polygon as MplPolygon
from matplotlib.collections import PatchCollection
import matplotlib.patheffects as pe
import numpy as np
# ---------------------------------------------------------------------------
# Paths
# ---------------------------------------------------------------------------
SCRIPT_DIR = Path(__file__).parent.resolve()
DATA_DIR = SCRIPT_DIR / "data"
REPO_ROOT = SCRIPT_DIR.parent
MD_OUT = REPO_ROOT / "tables-fauna.md"
IMG_OUT = REPO_ROOT / "site" / "images" / "fauna-distribution.png"
GADM_JSON = DATA_DIR / "gadm41_NZL_1.json"
# DOC species distribution GeoJSON files (simplified, WGS84)
DOC_SPECIES = {
"Red deer": DATA_DIR / "doc-red-deer.geojson",
"Sika deer": DATA_DIR / "doc-sika-deer.geojson",
"Fallow deer": DATA_DIR / "doc-fallow-deer.geojson",
"Wapiti": DATA_DIR / "doc-wapiti.geojson",
"Chamois": DATA_DIR / "doc-chamois.geojson",
"Feral pig": DATA_DIR / "doc-feral-pig.geojson",
"Feral goat": DATA_DIR / "doc-feral-goat.geojson",
}
# Colors for DOC polygon species (fill, edge, alpha)
SPECIES_STYLE = {
"Red deer": {"fill": "#1a9641", "edge": "#0e6e2c", "alpha": 0.35},
"Sika deer": {"fill": "#78c679", "edge": "#4a8c50", "alpha": 0.45},
"Fallow deer": {"fill": "#c2e699", "edge": "#8aad5e", "alpha": 0.45},
"Wapiti": {"fill": "#006837", "edge": "#003d1f", "alpha": 0.55},
"Chamois": {"fill": "#9970ab", "edge": "#6a4d78", "alpha": 0.35},
"Feral pig": {"fill": "#d95f0e", "edge": "#a34a0b", "alpha": 0.30},
"Feral goat": {"fill": "#e31a1c", "edge": "#b01418", "alpha": 0.25},
}
# Regions to skip (offshore / out-of-frame)
GADM_SKIP_REGIONS = {"ChathamIslands", "NorthernIslands", "SouthernIslands"}
# ---------------------------------------------------------------------------
# Markdown content
# ---------------------------------------------------------------------------
HEADER = """\
# Doc #025 — Fauna Reference: NZ Animal Protein Resources
**Phase Tags:** 1–4
**Feasibility:** [A]–[C] depending on species and access
**Sources:** DOC (Department of Conservation), MPI (Ministry for Primary Industries),
Fish & Game New Zealand, NIWA, Stats NZ Agricultural Production Census 2023.
---
This document provides structured reference tables for New Zealand's animal protein
resources across four categories: domestic livestock, wild game, marine fisheries, and
freshwater species. A supplementary section addresses pest species with food value.
A protein-yield summary estimates total available animal protein under a disrupted-supply
scenario. Distribution data are summarised in the accompanying map.
---
"""
TABLE_1 = """\
## 1. Livestock Baseline (2023 National Estimates)
Sources: Stats NZ Agricultural Production Census 2023; MPI Situation and Outlook reports;
Beef + Lamb NZ; DairyNZ; NZ Pork; Poultry Industry Association of NZ.
| Species | National Herd/Flock (2023) | Primary Distribution | Daily Feed Requirement | Primary Products | Vulnerability to Supply Disruption |
|---|---|---|---|---|---|
| Dairy cattle | ~6.3 million | Waikato, Taranaki, Southland, Canterbury | 15–25 kg DM/cow/day (pasture-based) | Whole milk, cream, butter, cheese, beef (cull cows) | High — dependent on milking infrastructure, refrigeration, processing plants; culled within weeks if grid fails |
| Beef cattle | ~3.9 million | Widespread — hill country NI, Canterbury/Otago plains SI | 8–14 kg DM/head/day | Beef (prime cuts, manufacturing beef, hides, tallow) | Moderate — grass-fed, low input dependency; slaughter requires processing or field harvest |
| Sheep | ~25.3 million | Widespread — hill country, high country, lowland — SI dominant | 1.0–1.5 kg DM/head/day | Lamb, mutton, wool, lanolin, sheepskins | Low-moderate — low input requirements; can be home-slaughtered; wool valuable secondary product |
| Deer (farmed) | ~0.8 million | South Island high country, Waikato, Hawke's Bay | 5–8 kg DM/head/day | Venison, velvet, hides | Moderate — fencing-dependent; can be harvested in field |
| Pigs | ~0.3 million | Manawatu, Canterbury, Waikato, Southland | 2–3 kg compound feed/day (commercial) | Pork, lard, offal, hides | High — commercial pigs depend on compound feed supply; farmed extensively on pasture-based systems is feasible but low density |
| Poultry (layers) | ~4–5 million layers (est.) | Hawke's Bay, Canterbury, Waikato, Manawatu | ~110–120 g feed/hen/day | Eggs, meat | High — concentrated in large sheds, compound feed dependent; backyard flocks resilient |
| Poultry (broilers) | ~95–96 million (throughput/yr) | Canterbury, Waikato, Manawatu | ~100–110 g feed/day (6-week cycle) | Meat, feathers (insulation) | Very high — continuous throughput system; collapses rapidly without compound feed |
| Goats | ~170,000 (farmed) | Waikato, Northland, Marlborough | 1.5–2.5 kg DM/head/day | Milk, meat (chevon), fibre (Angora: mohair) | Low — browsers, adaptable to scrub; can sustain on marginal land |
| Horses | ~90,000–110,000 | Widespread, horse-country properties | 10–15 kg hay or pasture equivalent/day | Draught power (recovery value), limited meat (not traditional NZ practice) | Low nutritional input dependency; high value as draught animals in grid-down scenario |
| Bees (managed hives) | ~830,000 hives | Nationwide, concentrated in Waikato, Northland, Nelson, Otago | Nectar/pollen (pasture-dependent) | Honey, beeswax, pollination services (essential for food production) | Moderate — varroa management requires treatments; without miticides, hive collapse within 1–3 seasons |
**Note on totals:** Poultry figure (~100M) combines layers (~4–5M), broiler throughput (~95–96M/yr), and free-range/backyard stock.
Herd sizes are approximate; the 2023 census showed sheep numbers at multi-decade lows following land-use conversion.
---
"""
TABLE_2 = """\
## 2. Wild Game Species
Sources: DOC Game Animal Council (GAC) reports; Fish & Game NZ; MPI biosecurity records;
Landcare Research population estimates. Populations are estimates; wild animal censuses
carry ±30–50% uncertainty.
| Species | Estimated Population | Distribution | Legal Status | Meat Yield per Animal | Hunting Method | Sustainable Harvest Rate |
|---|---|---|---|---|---|---|
| Red deer (*Cervus elaphus*) | 250,000–400,000 | Widespread SI ranges (Fiordland, Marlborough, Nelson); localised NI (Kaweka, Kaimanawa, Urewera) | Game animal (unprotected); open season with bag limits on some blocks | 50–90 kg dressed weight (mature stag); 30–50 kg (hind) | Rifle, stalking; helicopter hunting; dog-and-knife in dense bush | Moderate — historically over-hunted; current populations support harvest if controlled; DOC/GAC management applies on Crown land |
| Fallow deer (*Dama dama*) | 30,000–60,000 | Scattered: Marlborough Sounds, Hawke's Bay, Southland, King Country | Game animal (unprotected) | 20–35 kg dressed weight | Rifle, stalking; some driven hunts | Moderate — localised populations; low reproductive rate; harvest should not exceed ~15–20% of local population/yr |
| Sika deer (*Cervus nippon*) | 60,000–100,000 | Central North Island: Kaimanawa, Kaweka, Urewera ranges | Game animal (unprotected) | 20–40 kg dressed weight | Rifle, stalking; roar-season calling | Moderate — dense in core range; good protein source; hunt pressure has increased in recent years |
| Himalayan thar (*Hemitragus jemlahicus*) | 10,000–15,000 (post-control) | Canterbury and Otago high-alpine zones (Mt Cook, Mackenzie) | Controlled pest; legal to shoot; DOC maintains suppression | 25–50 kg dressed weight (bull) | High-country rifle; specialist terrain | Low — populations actively managed downward by DOC; not a stable long-term harvest resource |
| Chamois (*Rupicapra rupicapra*) | 50,000–100,000 | SI alpine and subalpine zones, Nelson to Fiordland | Controlled pest; legal to shoot | 15–25 kg dressed weight | High-country rifle; demanding terrain | Moderate — widespread but thin density; harvest limited by terrain access |
| Wild pigs (*Sus scrofa*) | 400,000–500,000 | Widespread NI and SI bush-edge, scrubland, riverbeds; Northland, King Country, Westland, Southland | Unprotected pest | 30–80 kg liveweight; 40–50% dressing yield | Dogs + knife; rifle; traps; electric fences for pig drives | High — high reproductive rate (2 litters/yr, 4–8 piglets each); very high sustainable yield; primary wild protein source |
| Wild goats (*Capra hircus*) | 1,000,000+ | Widespread NI and SI — scrubland, hill country, coastal cliffs; especially Northland, East Coast, Marlborough | Unprotected pest | 10–25 kg dressed weight | Rifle; dogs; trapping | Very high — prolific breeders; large reservoir of protein; will expand rapidly without culling |
| Wallaby (Dama/Bennett's) | 50,000–300,000 (range disputed) | South Canterbury (Dama wallaby); Rotorua area (Bennett's); Marlborough (Bennett's) | Controlled pest under Biosecurity Act | 5–10 kg dressed weight | Rifle; night shooting; traps | High locally — actively suppressed; harvest beneficial for control |
| Possums (*Trichosurus vulpecula*) | 30–70 million (estimates vary widely) | Nationwide in native bush and scrub; highest density SI west coast, NI forested areas | Unprotected pest | 0.5–1.2 kg meat yield; pelt commercially valuable (~50 g fibre/animal) | Traps (leg-hold, kill traps); poison (1080, brodifacoum — not food-safe if poisoned); dogs; rifle at night | Very high — prolific breeder; major protein reservoir if harvested through non-poison methods |
| Rabbits (*Oryctolagus cuniculus*) | 10,000,000–30,000,000 (cycle-dependent) | SI eastern dryland zones: Mackenzie Basin, Central Otago, Marlborough; localised NI | Unprotected pest (managed under RMA and Biosecurity Act) | 0.8–1.2 kg dressed weight | Traps; rifle; ferrets; netting; night lamping | Very high — population cycles; boom years provide extraordinary protein supply; primary small-game resource |
| Hares (*Lepus europaeus*) | 500,000–1,000,000 | Open farmland, tussock grassland nationwide; SI eastern plains, NI volcanic plateau | Unprotected | 1.5–2.5 kg dressed weight | Rifle; dogs; traps | High — not as abundant as rabbits but larger body; good fur for insulation |
| Wild/feral cattle | Localised herds (<5,000 total) | West Coast SI, Fiordland, parts of Northland; isolated properties | Unprotected where on private land; DOC controls on Crown land | 150–300 kg dressed weight | Rifle; difficult terrain | Low — small populations; valuable but not a reliable broad-scale resource |
**Poison caution:** Animals taken from areas subject to aerial 1080 or brodifacoum operations should not be eaten.
Check DOC and regional council operation schedules. Poison residues can persist in liver and kidney tissue for weeks.
---
"""
TABLE_3 = """\
## 3. Marine Species
Sources: MPI Fisheries New Zealand quota reports; NIWA stock assessments; Marine Stewardship
Council (MSC) certification status; Seafood New Zealand industry data. Annual catch figures
are approximate 3-year averages (2020–2023).
| Species | NZ Catch Zone | Annual Commercial Catch | Recreational Importance | Sustainability Status | Protein Yield (edible) |
|---|---|---|---|---|---|
| Snapper (*Pagrus auratus*) | SNA 1 (Hauraki Gulf, NI east coast); SNA 8 (NW South Island) | ~4,500 t (SNA 1 most fished) | Very high — primary target for recreational NI fishers | Overfished in SNA 1 (rebuilding); Quota Management System (QMS) applies | ~18–20% of liveweight; fillets ~45% of dressed weight |
| Blue cod (*Parapercis colias*) | BCO 7 (Marlborough Sounds); BCO 2–8 various SI zones | ~1,500 t | Very high — primary SI recreational target | Concerns in Marlborough Sounds; some closures imposed 2020–2023 | ~35% edible yield from whole fish |
| Tarakihi (*Nemadactylus macropterus*) | TAR 1–7 (widespread) | ~5,000 t | Moderate — popular table fish | Concerns in some stocks; TAR 1 under rebuilding strategy | ~35% edible yield |
| Gurnard (*Chelidonichthys kumu*) | GUR 1, 7, 8 (NI and SI coasts) | ~2,500 t | Moderate — underrated eating quality | Reasonably healthy; less fishing pressure | ~30% edible yield (bony head) |
| Trevally (*Pseudocaranx georgianus*) | TR 1, 2 (NI east/west coasts) | ~2,000 t | Moderate — strong fighter; good eating | Considered healthy | ~40% edible yield |
| Kahawai (*Arripis trutta*) | KAH 1 (nationwide) | ~6,500 t | Very high — accessible from shore and boat | Generally healthy; abundant and fast-reproducing | ~40% edible yield; excellent smoked |
| Kingfish / yellowtail (*Seriola lalandi*) | KIN 1 (NI primarily) | ~700 t | High — prized sport and table fish | Considered healthy; warm-water association | ~45% edible yield; high omega-3 |
| Crayfish / rock lobster (*Jasus edwardsii*) | CRA 2–9 (nationwide inshore) | ~5,000 t (high export value) | High — regulated recreational bag limits | Managed; some concerns in CRA 2 (Kaikōura) post-earthquake; QMS applies | ~25–30% edible meat from whole animal |
| Paua (*Haliotis iris*) | PAU 1–7 (inshore reef) | ~450 t commercial; significant poaching pressure | Very high — culturally significant; high recreational and black market pressure | Concerns in several regions; strict bag limits (10/day recreational) | ~50% edible yield (muscle); highly nutritious |
| Green-lipped mussels (*Perna canaliculus*) | Farm-based (Marlborough Sounds primary); wild harvest minor | ~100,000 t (aquaculture, mostly export) | Low commercial recreational; easy to gather from rocky shores | Farmed stocks healthy; wild populations variable | ~20–25% edible meat yield from shell |
| Pacific oysters (*Crassostrea gigas*) | Aquaculture: Northland, Coromandel, Nelson; wild intertidal | ~3,000 t (aquaculture) | Moderate — intertidal harvest accessible to general public | Aquaculture stocks healthy; wild populations reduced by disease and overharvest historically | ~10–15% edible yield from shell; very high nutritional density |
| Scallops (*Pecten novaezelandiae*) | SCA 1–9; Marlborough, Golden Bay, Tasman Bay primary | ~2,000 t | Moderate — dredging and diving | Some stocks depleted; rotational management in some areas | ~15% edible yield (adductor + roe) |
| Hoki (*Macruronus novaezelandiae*) | HOK 1 (deep water, nationwide) | ~150,000 t (largest NZ commercial catch) | Low — deepwater; not accessible recreationally | MSC certified; considered sustainable | ~40% edible yield; lean white flesh |
| Orange roughy (*Hoplostethus atlanticus*) | ORH 3A–7A (deep seamounts) | ~8,000 t | None — deepwater only | Historically heavily depleted; some stocks rebuilding; very slow reproductive rate (150+ year lifespan) | ~40% edible yield; high moisture content |
| Ling (*Genypterus blacodes*) | LIN 1–7 (mid-depth, widespread) | ~18,000 t | Low — deepwater | Generally healthy | ~45% edible yield; excellent smoked |
| Squid (*Nototodarus sloanii / gouldi*) | SQU 1T (widespread) | ~50,000–80,000 t (highly variable, year-dependent) | Low — some jig fishing | Highly variable; short-lived species, naturally boom-bust | ~60–70% edible yield (mantle, tentacles); high protein |
**Disruption note:** Marine fisheries remain accessible without grid infrastructure if small-boat access is maintained.
Coastal communities with boats, nets, and basic preservation (salt, smoking, drying) can sustain significant protein intake
from nearshore species. Deepwater species (hoki, orange roughy, ling, squid) require commercial-scale vessels and are
not available in a localised disruption scenario.
---
"""
TABLE_4 = """\
## 4. Freshwater Species
Sources: Fish & Game New Zealand; NIWA; DOC Freshwater biodiversity assessments; Te Ara Encyclopedia of NZ.
| Species | Distribution | Legal/Conservation Status | Estimated Population / Catch | Meat Yield | Harvest Method | Notes |
|---|---|---|---|---|---|---|
| Brown trout (*Salmo trutta*) | Nationwide — rivers, lakes, streams; most abundant SI and mountain-fed NI waterways | Introduced sport fish; managed by Fish & Game; angling licence required | Wide; sustainable recreational fishery; population maintained by Fish & Game stocking in many systems | ~40–55% edible yield; average fish 0.5–3 kg (rivers); lake fish larger | Fly fishing, spin fishing, bait; no commercial harvest | Highest per-capita angling value in NZ; populations robust in cold-water systems; vulnerable to sedimentation and warming |
| Rainbow trout (*Oncorhynchus mykiss*) | Lake Taupō and Rotorua system (premier); widespread elsewhere; including aquaculture | Introduced; managed by Fish & Game; Taupō fishery legally unique (charter guided primarily) | Lake Taupō yield ~400–600 t/yr (recreational + guided); substantial but uncounted elsewhere | ~40–55% edible yield; average fish 0.8–4 kg; Taupō fish typically larger | Fly, spinning, trolling, harling | Very high nutritional quality; high omega-3 fatty acids; Taupō fishery is regulated separately under Taupō Fishery Regulations |
| Shortfin eel (*Anguilla australis*) | Lowland rivers and lakes throughout NI and SI; tolerates degraded habitat | Native; commercially fished under QMS (EEL 1–9); recreational harvest restricted | Commercial catch ~600–800 t/yr; population declining in many systems | ~60% edible yield (high fat content, excellent for smoking) | Fyke nets (commercial); eel traps; hand-lining; longline | High cultural value (taonga species to Māori — tuna); smoking is primary preservation method; fat content makes caloric yield very high |
| Longfin eel (*Anguilla dieffenbachii*) | NI and SI native waterways; endemic to NZ; climbs waterfalls and reaches headwaters | Native; **at risk — declining**; some recreational and commercial harvest; increasingly restricted | Declining; commercial harvest being phased down in many areas | ~60% edible yield (large animals); can reach 1–2 m, 10–20 kg | Fyke nets (commercial, declining); traditional Māori weir traps | Do not target for subsistence without confirming local status — populations severely depleted in many catchments; cultural protocols apply |
| Whitebait (5 galaxiid species) | Coastal rivers and streams NI and SI; spring migration (Aug–Nov) | Native; several species at risk or declining; managed under Whitebait Fishing Regulations 1994; daily bag limits | Highly variable; some rivers support good runs; Canterbury Rivers (Waimakariri, Rakaia) significant | ~95% edible (whole fish, including bones) — primary NZ preparation is whitebait fritter | Scoop nets, stand nets at river mouths during migration season; strict gear and season regulations | Highly prized delicacy; all 5 galaxiid species now classified as at-risk or threatened; commercial harvest effectively nil; harvest pressure should remain low in disruption scenario |
| Koura / freshwater crayfish (*Paranephrops spp.*) | Nationwide in clean, cold waterways; indicator species for water quality | Native; two species (P. planifrons, P. zealandicus); recreational harvest permitted with licence; commercial harvest limited | Localised; declining in modified waterways | ~25–30% edible meat yield; small animals (10–50 g whole) | Hand-netting, small traps, diving; seasonal bag limits apply | High nutritional density; culturally significant (taonga); habitat quality is the primary constraint — koura absent from degraded waterways |
---
"""
TABLE_5 = """\
## 5. Pest Species with Food Value
Harvesting pest species serves a dual purpose: protein acquisition and pest control.
These species have no legal protection and in most cases active culling is encouraged.
**Exception:** animals taken from poison-treated areas must not be consumed.
| Species | Estimated NZ Population | Protein / Product Value | Recommended Harvest | Poison-Area Caution | Practical Notes |
|---|---|---|---|---|---|
| Possums (*Trichosurus vulpecula*) | 30–70 million | Meat: 0.5–1.2 kg edible/animal (lean, mild flavour); Pelt: ~50 g fine wool-blend fibre; pelt tanned for fur products | High — trap-based harvest preferable; kill traps (Timms, DOC 250) most efficient | **Critical** — widespread 1080 and brodifacoum use; do not consume from any area treated within 8–12 weeks minimum | Historically eaten by early European settlers and Māori; meat requires thorough cooking; pelt valuable for insulation garments and trade |
| Rabbits (*Oryctolagus cuniculus*) | 10–30 million (population cycles) | 0.8–1.2 kg dressed weight; lean, high-quality protein; pelt useful for insulation/felt | Very high — primary small-game protein resource in SI drylands; wire snares, box traps, night lamping | Poison operations (pindone, 1080) common in Central Otago/Mackenzie — check regional council records | Easy to trap and field-dress; can be sun-dried or smoked for preservation; pelts need curing |
| Wallabies (*Macropus eugenii / Notamacropus rufogriseus*) | 50,000–300,000 | 5–10 kg dressed weight; lean, similar to venison; pelt usable | Moderate — localised harvest opportunity; rifle or traps | Occasional poison operations in some management zones — check with regional council | Marsupial meat; low fat, high protein; field-dress promptly in warm weather |
| Wild pigs (*Sus scrofa*) | 400,000–500,000 | 30–80 kg liveweight; 40–50% dressing yield; lard from large boars is significant fat source; trotters, offal usable | Very high — all methods; dogs+knife most efficient in dense bush; rifle in open country | Rare — some targeted poisoning in conservation areas; uncommon for pigs | Primary fat source in wild harvest scenario; lard rendering critical for cooking and preservation; head cheese, salami, sausage feasible with minimal equipment |
| Wild goats (*Capra hircus*) | 1,000,000+ | 10–25 kg dressed weight; lean; milk if live-captured (does with kids) | Very high — rifle, dogs, traps | Rare | Young kids (under 6 months) preferred for eating; older animals stringy but nutritious; live capture for milk production is viable |
| Feral cats (*Felis catus*) | 1.5–2.5 million (est.) | Pelt: useful for small fur items (gloves, hat lining); Meat: technically edible but culturally avoided in NZ context | **Fur only** — harvest for pelt value; meat harvest not recommended except in extremis | Unlikely to encounter in poison zones | Cats are effective pest predators; their pest-control value may exceed their protein value; culling near bird habitat recommended |
| Rats (*Rattus norvegicus / R. rattus / R. exulans*) | Widespread; tens of millions | Technically edible; high protein; documented as survival food in many cultures | **Not recommended** under normal disruption** — disease risk (leptospirosis, salmonella); limited yield; trapping effort high relative to caloric return | N/A — rats often secondary poison targets | Included for completeness; historical survival use documented; should not be primary food source; leptospirosis transmission through handling is primary concern — wear gloves, cook thoroughly |
---
"""
TABLE_6 = """\
## 6. Protein Yield Summary — Disrupted-Supply Scenario
This table estimates aggregate animal protein available to NZ's ~5 million population
under a disrupted-supply scenario in which supply chains are impaired but not absent.
Assumptions: (a) domestic livestock partially maintained at 60% of current levels;
(b) commercial fishing continues at 40% capacity (nearshore only); (c) wild harvest
increases significantly as demand substitutes for commercial supply; (d) aquaculture
maintains 70% output.
**Scenario: 12-month post-disruption estimate**
| Source Category | Estimated Available Live-Weight or Product | Estimated Edible Protein (tonnes) | Per-Capita Daily Protein (g/person/day, NZ 5M pop.) | Notes |
|---|---|---|---|---|
| Dairy cattle (cull cows + beef by-product) | ~2.3M cull animals over 12 months (partial herd) | ~350,000 t | ~192 g | Dairy herd culled rapidly without refrigeration infrastructure; high short-term surplus, then decline |
| Beef cattle | ~2.3M head harvested over 12 months | ~420,000 t | ~230 g | Grass-fed; can be field-harvested; salting/drying feasible for preservation |
| Sheep | ~15M head harvested over 12 months (at 60% herd) | ~225,000 t | ~123 g | Most practical large-animal protein source; carcass weight ~20 kg; field slaughter feasible |
| Pigs (domestic + wild) | ~180,000 t combined | ~90,000 t | ~49 g | Commercial pigs decline rapidly; wild pig population buffers loss |
| Poultry (backyard + surviving commercial) | Reduced to ~15% of current output | ~35,000 t | ~19 g | Eggs critically important; backyard flocks resilient; commercial broiler system collapses |
| Wild deer (all species) | ~80,000–120,000 animals harvested/yr (sustainable) | ~7,000 t | ~4 g | Terrain-limited; high-value supplement; not a primary protein source at scale |
| Wild pigs | ~200,000 animals/yr (sustainable + surge) | ~15,000 t | ~8 g | High harvest potential; lard adds critical fat calories |
| Wild goats + rabbits + wallabies | ~350,000 animals/yr combined | ~8,000 t | ~4 g | Small-game category; important for rural and remote communities |
| Possums (non-poison areas) | ~5,000,000 animals/yr (low estimate, non-poisoned zones) | ~3,500 t | ~2 g | Pelt value may exceed meat value economically |
| Nearshore marine (40% commercial + recreational) | ~120,000 t landed weight | ~45,000 t | ~25 g | Kahawai, gurnard, trevally, squid — high volume species; coastal communities most advantaged |
| Shellfish (mussels, oysters, paua, scallops) | ~60,000 t (aquaculture + intertidal gathering) | ~12,000 t | ~7 g | Very high accessibility for coastal communities; critical micronutrient source (zinc, B12, iron) |
| Freshwater (trout, eel, whitebait, koura) | ~15,000 t total (sustainable) | ~7,000 t | ~4 g | High-quality protein; distributed across river catchments; whitebait protected — harvest cautiously |
| **TOTAL ESTIMATED** | — | **~1,217,500 t protein (aggregate)** | **~667 g/person/day (aggregate)** | **NB: This is a theoretical aggregate — actual access is highly uneven geographically; urban populations face acute deficits; rural and coastal populations face relative surplus** |
**Critical caveats:**
1. The aggregate figure (~667 g protein/person/day) far exceeds daily requirements (~50–60 g/day) but is a **theoretical maximum**
— actual distribution is severely constrained by geography, infrastructure, preservation capacity, and cooking fuel availability.
2. Urban populations (Auckland, Wellington, Christchurch) have very low wild-harvest access; they depend almost entirely on
domestic livestock processed through supply chains.
3. The largest short-term protein surplus comes from mass livestock culling in the first 3–6 months; after this the protein
base stabilises at a much lower level unless herds are maintained.
4. Preservation is the critical bottleneck — salting, smoking, drying, and fermentation are the primary methods available
without refrigeration. Each method requires infrastructure inputs (salt, firewood, time, labour) that are not always available.
5. Marine protein is among the most resilient categories: it requires no land, no feed inputs, and minimal infrastructure
for nearshore harvest.
---
## Footnotes and Sources
1. Stats NZ *Agricultural Production Census 2023* — livestock headcounts, regional distribution.
2. MPI *Situation and Outlook for Primary Industries* (SOPI) June 2023 — sector summaries.
3. Beef + Lamb New Zealand *Industry Statistics 2023* — sheep and beef herd data.
4. DairyNZ *New Zealand Dairy Statistics 2022–23* — dairy cow numbers, regional breakdown.
5. DOC *Game Animal Council reports* and annual harvest data — deer, thar, chamois, wild pig populations.
6. Fish & Game New Zealand *Annual Reports* — trout fishery statistics, freshwater species status.
7. NIWA *Freshwater biodiversity and water quality assessments* — galaxiid and eel population status.
8. MPI Fisheries New Zealand *Fisheries Assessment Plenary* — commercial catch data, stock status by QMS species.
9. Seafood New Zealand *Industry Statistics* — aquaculture production (mussels, oysters, salmon).
10. DOC *Possum Control Area Network* data — possum density estimates; Warburton et al. (2009) density review.
11. Landcare Research *Rabbit population surveys* — Central Otago and Mackenzie Basin population estimates.
12. NIWA *National River Water Quality Network* — koura distribution and habitat quality.
13. Te Ara: The Encyclopedia of New Zealand — cultural context for eels (tuna), whitebait, and freshwater species.
"""
# ---------------------------------------------------------------------------
# Supplementary point data (species without DOC polygon data)
# ---------------------------------------------------------------------------
# Thar: Canterbury Alps (no DOC polygon data available)
THAR = [
(170.1, -43.7), (169.9, -43.5), (170.3, -43.9),
(170.0, -44.1), (169.7, -43.8),
]
# Rabbit zones: SI eastern dryland (no DOC polygon data available)
RABBIT_ZONES = [
(170.2, -44.0), # Mackenzie Basin
(169.3, -45.0), # Central Otago (Alexandra/Cromwell)
(171.5, -43.6), # Mid-Canterbury (inland foothills)
(172.0, -42.8), # North Canterbury (Amberley/Waipara)
(173.5, -41.7), # Marlborough (Wairau/Awatere dryland)
]
# Fishing zones (offshore/coastal centres — placed clearly in water)
FISHING_ZONES = {
"Hauraki Gulf\n(snapper, kahawai)": (175.5, -36.5),
"East Cape\n(trevally, kingfish)": (178.2, -37.7),
"Hawke Bay\n(snapper, tarakihi)": (177.3, -39.6),
"Cook Strait\n(blue cod, tarakihi)": (174.8, -41.6),
"Marlborough\n(blue cod, scallops)": (174.4, -41.0),
"Kaikoura\n(crayfish)": (173.9, -42.3),
"Fiordland\n(blue cod, crayfish)": (166.5, -45.3),
"Foveaux Strait\n(blue cod, oysters)": (167.8, -46.8),
"Otago\n(blue cod, tarakihi)": (171.5, -46.0),
"West Coast\n(kahawai, ling)": (170.8, -43.0),
}
# ---------------------------------------------------------------------------
# Generate map
# ---------------------------------------------------------------------------
def load_gadm_regions(path, skip_regions=None):
"""Load GADM GeoJSON and return a list of (name, polygons) tuples."""
if skip_regions is None:
skip_regions = set()
with open(path) as f:
data = json.load(f)
regions = []
for feat in data["features"]:
name = feat["properties"].get("NAME_1", "")
if name in skip_regions:
continue
geom = feat["geometry"]
if geom["type"] == "MultiPolygon":
polygons = geom["coordinates"]
elif geom["type"] == "Polygon":
polygons = [geom["coordinates"]]
else:
continue
regions.append((name, polygons))
return regions
def plot_gadm_regions(ax, regions, fill_color="#e8e0d0", edge_color="#888888",
edge_width=0.4):
"""Draw filled GADM region polygons as the base land layer (zorder=1)."""
patches = []
for _name, polygons in regions:
for polygon in polygons:
exterior = polygon[0]
verts = [(pt[0], pt[1]) for pt in exterior]
patch = MplPolygon(verts, closed=True)
patches.append(patch)
pc = PatchCollection(
patches,
facecolor=fill_color,
edgecolor=edge_color,
linewidths=edge_width,
zorder=1,
)
ax.add_collection(pc)
def load_doc_species(path, bbox=(165.5, -47.5, 179.0, -34.0)):
"""Load a DOC species GeoJSON file. Returns list of polygon coordinate arrays.
Each entry is a list of rings (exterior + holes). Handles both
Polygon and MultiPolygon geometry types. Filters out polygons whose
centroid falls outside ``bbox`` (lon_min, lat_min, lon_max, lat_max)
to exclude Chatham Islands and other offshore data.
"""
with open(path) as f:
data = json.load(f)
polygons = []
for feat in data["features"]:
geom = feat["geometry"]
if geom["type"] == "MultiPolygon":
polys = geom["coordinates"]
elif geom["type"] == "Polygon":
polys = [geom["coordinates"]]
else:
continue
for poly in polys:
ext = poly[0]
cx = sum(p[0] for p in ext) / len(ext)
cy = sum(p[1] for p in ext) / len(ext)
if bbox[0] <= cx <= bbox[2] and bbox[1] <= cy <= bbox[3]:
polygons.append(poly)
return polygons
def plot_species_polygons(ax, polygons, fill_color, edge_color, alpha, zorder=3):
"""Render DOC species range polygons on the map."""
patches = []
for poly_rings in polygons:
exterior = poly_rings[0]
verts = [(pt[0], pt[1]) for pt in exterior]
if len(verts) < 3:
continue
patch = MplPolygon(verts, closed=True)
patches.append(patch)
if not patches:
return
pc = PatchCollection(
patches,
facecolor=fill_color,
edgecolor=edge_color,
linewidths=0.3,
alpha=alpha,
zorder=zorder,
)
ax.add_collection(pc)
def generate_map(gadm_path, output_path):
regions = load_gadm_regions(gadm_path, skip_regions=GADM_SKIP_REGIONS)
fig, ax = plt.subplots(figsize=(8, 11), dpi=200)
ax.set_facecolor("#c8d8e8") # ocean blue-grey
fig.patch.set_facecolor("#f5f5f0")
# Base layer: GADM regional boundaries as filled land polygons
plot_gadm_regions(ax, regions)
# --- DOC species range polygons ---
# Draw order: most widespread first (lowest zorder), most localised last
draw_order = [
"Feral goat", "Feral pig", "Red deer", "Fallow deer",
"Chamois", "Sika deer", "Wapiti",
]
for i, species_name in enumerate(draw_order):
path = DOC_SPECIES[species_name]
if not path.exists():
print(f" WARNING: Missing DOC data for {species_name}: {path}")
continue
style = SPECIES_STYLE[species_name]
polys = load_doc_species(path)
plot_species_polygons(
ax, polys,
fill_color=style["fill"],
edge_color=style["edge"],
alpha=style["alpha"],
zorder=3 + i,
)
print(f" Plotted {species_name}: {len(polys)} polygons")
# --- Thar (point markers — no DOC polygon data) ---
for lon, lat in THAR:
ax.plot(lon, lat, "P", color="#9970ab", markersize=7, zorder=11,
markeredgecolor="white", markeredgewidth=0.4, alpha=0.9)
# --- Rabbit zones (point markers — no DOC polygon data) ---
for lon, lat in RABBIT_ZONES:
circle = plt.Circle((lon, lat), 0.2, color="#fd8d3c", alpha=0.22, zorder=3)
ax.add_patch(circle)
ax.plot(lon, lat, "D", color="#fd8d3c", markersize=5, zorder=11,
markeredgecolor="white", markeredgewidth=0.4, alpha=0.9)
# --- Fishing zones (point markers) ---
for label, (lon, lat) in FISHING_ZONES.items():
ax.plot(lon, lat, "o", color="#2166ac", markersize=4, zorder=12, alpha=0.7)
# Set map extent
ax.set_xlim(165.5, 179.0)
ax.set_ylim(-47.5, -34.0)
ax.set_aspect("equal")
# Axis labels
ax.set_xlabel("Longitude (°E)", fontsize=8, color="#333333")
ax.set_ylabel("Latitude (°S)", fontsize=8, color="#333333")
ax.tick_params(labelsize=7, colors="#555555")
# Gridlines
ax.grid(True, linestyle="--", linewidth=0.3, color="#999999", alpha=0.5, zorder=0)
# Title
ax.set_title("NZ Wild Fauna Distribution — DOC Survey Data\n(Recovery Library — Doc #025)",
fontsize=11, fontweight="bold", color="#1a1a1a", pad=10)
# Legend — polygon patches for DOC species, point markers for supplementary
legend_elements = [
mpatches.Patch(facecolor="#e8e0d0", edgecolor="#888888",
linewidth=0.6, label="Land (GADM regions)"),
mpatches.Patch(facecolor="#1a9641", edgecolor="#0e6e2c",
alpha=0.5, linewidth=0.5, label="Red deer"),
mpatches.Patch(facecolor="#78c679", edgecolor="#4a8c50",
alpha=0.6, linewidth=0.5, label="Sika deer"),
mpatches.Patch(facecolor="#c2e699", edgecolor="#8aad5e",
alpha=0.6, linewidth=0.5, label="Fallow deer"),
mpatches.Patch(facecolor="#006837", edgecolor="#003d1f",
alpha=0.7, linewidth=0.5, label="Wapiti"),
mpatches.Patch(facecolor="#9970ab", edgecolor="#6a4d78",
alpha=0.5, linewidth=0.5, label="Chamois"),
mpatches.Patch(facecolor="#d95f0e", edgecolor="#a34a0b",
alpha=0.45, linewidth=0.5, label="Feral pig"),
mpatches.Patch(facecolor="#e31a1c", edgecolor="#b01418",
alpha=0.4, linewidth=0.5, label="Feral goat"),
plt.Line2D([0], [0], marker="P", color="w", markerfacecolor="#9970ab",
markersize=8, label="Thar (point est.)"),
plt.Line2D([0], [0], marker="D", color="w", markerfacecolor="#fd8d3c",
markersize=7, label="Rabbits (point est.)"),
plt.Line2D([0], [0], marker="o", color="w", markerfacecolor="#2166ac",
markersize=7, alpha=0.7, label="Fishing zones"),
]
legend = ax.legend(
handles=legend_elements,
loc="upper left",
fontsize=6.5,
framealpha=0.92,
edgecolor="#aaaaaa",
fancybox=False,
title="Species Ranges (DOC 2007–2014)",
title_fontsize=7,
borderpad=0.8,
labelspacing=0.5,
handletextpad=0.6,
)
legend.get_frame().set_linewidth(0.5)
# Source note
fig.text(0.5, 0.01,
"Boundaries: GADM v4.1 (gadm.org), CC BY 4.0. "
"Fauna data: DOC, MPI, Fish & Game NZ estimates.",
ha="center", fontsize=5.5, color="#666666", style="italic")
# North arrow
ax.annotate("N", xy=(178.3, -34.7), fontsize=10, fontweight="bold",
ha="center", va="center", color="#333333", zorder=15)
ax.annotate("", xy=(178.3, -34.5), xytext=(178.3, -35.1),
arrowprops=dict(arrowstyle="->", color="#333333", lw=1.2), zorder=15)
plt.tight_layout(rect=[0, 0.02, 1, 1])
output_path = Path(output_path)
output_path.parent.mkdir(parents=True, exist_ok=True)
fig.savefig(output_path, dpi=200, bbox_inches="tight", facecolor=fig.get_facecolor())
plt.close(fig)
print(f"Map saved: {output_path}")
# ---------------------------------------------------------------------------
# Generate markdown
# ---------------------------------------------------------------------------
def generate_markdown(output_path):
content = HEADER + TABLE_1 + TABLE_2 + TABLE_3 + TABLE_4 + TABLE_5 + TABLE_6
output_path = Path(output_path)
output_path.parent.mkdir(parents=True, exist_ok=True)
output_path.write_text(content, encoding="utf-8")
print(f"Markdown saved: {output_path}")
# ---------------------------------------------------------------------------
# Main
# ---------------------------------------------------------------------------
def main():
print("Recovery Library — Doc #025: Fauna Reference Generator")
print(f" GADM boundaries: {GADM_JSON}")
print(f" Markdown output: {MD_OUT}")
print(f" Map output: {IMG_OUT}")
if not GADM_JSON.exists():
print(f"ERROR: GADM boundary data not found at {GADM_JSON}", file=sys.stderr)
sys.exit(1)
generate_markdown(MD_OUT)
generate_map(GADM_JSON, IMG_OUT)
print("Done.")
if __name__ == "__main__":
main()Data Sources
Species Distribution Data (Map)
- DOC Open Spatial Data — Species range
polygons downloaded from
doc-deptconservation.opendata.arcgis.comvia ArcGIS Hub API. No login required. Survey dates 2007–2014. Original data in NZTM2000 (EPSG:2193); reprojected to WGS84 and simplified via Douglas-Peucker at 2 km resolution for atlas-scale rendering.- Red deer: Item ID
4a6db6e864c94fb2a9503d1f217d9723 - Feral pig: Item ID
f7958ac7ee9f4d27974b3193ce7e20f6 - Feral goat: Item ID
5bb31202da354a7fad6149d0adece561 - Chamois: Item ID
18b627a2898343b89c2d3587e3b16278 - Sika deer: Item ID
e0a05a33917e47728caab4b38c458cbe - Fallow deer: Item ID
4ca2ff58c4ac45ba984791edb6d952bf - Wapiti: Item ID
bb77dc97f05d44d4a101aa07cb09d91b - Download URL pattern:
https://doc-deptconservation.opendata.arcgis.com/api/down...
- Red deer: Item ID
- GADM v4.1 — Administrative boundaries for NZ
(
gadm41_NZL_1.json), used as base land layer. Source:gadm.org.
Table Data
- Stats NZ Agricultural Production Census 2023 — livestock headcounts and regional distribution for all domestic species.
- MPI Situation and Outlook for Primary Industries (SOPI) June 2023 — sector-level summaries for livestock and fisheries.
- Beef + Lamb New Zealand Industry Statistics 2023 — sheep and beef herd data and production metrics.
- DairyNZ New Zealand Dairy Statistics 2022–23 — dairy cow numbers by region.
- DOC Game Animal Council reports — deer, thar, chamois, and wild pig population estimates and harvest data.
- Fish & Game New Zealand Annual Reports — trout fishery statistics, freshwater species status, and angling licence data.
- NIWA Freshwater biodiversity and water quality assessments — galaxiid species status, eel population trends, and koura distribution.
- MPI Fisheries New Zealand Fisheries Assessment Plenary — commercial catch data and QMS stock status for all listed marine species.
- Seafood New Zealand Industry Statistics — aquaculture production data for mussels, oysters, and salmon.
- DOC Possum Control Area Network — possum density estimates; Warburton et al. (2009) density review.
- Landcare Research rabbit population surveys — Central Otago and Mackenzie Basin population cycle data.
- Te Ara: The Encyclopedia of New Zealand — cultural context for eels (tuna), whitebait, and freshwater species.