This Python script generates the Infrastructure Index and Atlas used by Doc #016 (Infrastructure Atlas). It produces structured reference tables covering New Zealand’s major cities, commercial ports, airports, power generation stations, hospitals, key industrial sites, and an inter-city distance matrix computed via the Haversine formula. It also generates two map images: a full national infrastructure overview and a Wellington region detail map. Maps are rendered using GADM v4.1 Level 1 administrative boundaries (filled polygons with regional borders) when available, with the legacy NZ coastline JSON as a fallback.
Requirements: Python 3.6+ with matplotlib.
Also requires scripts/data/gadm41_NZL_1.json (GADM
v4.1 NZ Level 1 boundaries) for filled-polygon map rendering. The
script falls back to scripts/data/nz-coastline.json
(coastline outlines) if the GADM file is not present.
Usage:
python scripts/generate_infrastructure_index.py
# Default output: tables-infrastructure.md + site/images/infrastructure-*.png
Output: -
tables-infrastructure.md — tables for cities, ports,
airports, power stations, hospitals, industrial sites, and the
18-city distance matrix -
site/images/infrastructure-nz.png — full NZ
infrastructure overview map -
site/images/infrastructure-wellington.png —
Wellington region detail map
Source Code
#!/usr/bin/env python3
"""
Generate tables-infrastructure.md and infrastructure map PNGs for the Recovery Library.
Doc #016: Infrastructure Atlas
Produces:
../tables-infrastructure.md — tables for cities, ports, airports, power, hospitals, industry, distances
../site/images/infrastructure-nz.png — full NZ overview map
../site/images/infrastructure-wellington.png — Wellington region detail map
Usage:
scripts/.venv/bin/python generate_infrastructure_index.py
Requirements:
matplotlib (pip install matplotlib)
NZ coastline data at: data/nz-coastline.json
GADM NZ Level 1 boundaries at: data/gadm41_NZL_1.json
"""
import json
import math
import os
import sys
# ---------------------------------------------------------------------------
# Data definitions
# ---------------------------------------------------------------------------
CITIES = [
# name, population, lon, lat, region, elevation_m
# [data omitted for brevity — 18 cities: Auckland, Hamilton, Tauranga,
# Wellington, Christchurch, Dunedin, Napier-Hastings, Palmerston North,
# Nelson, New Plymouth, Invercargill, Rotorua, Whangarei, Queenstown,
# Lower Hutt, Upper Hutt, Porirua, Paraparaumu]
]
PORTS = [
# name, lon, lat, throughput, unit, max_vessel, key_exports
# [data omitted for brevity — 11 ports: Auckland, Tauranga, Lyttelton,
# Napier, Wellington, Port Chalmers, Bluff, Nelson, New Plymouth,
# Timaru, Marsden Point]
]
AIRPORTS = [
# name, ICAO, lon, lat, runway_m, surface, capabilities
# [data omitted for brevity — 12 airports: Auckland International,
# Wellington International, Christchurch International, Queenstown,
# Dunedin International, Hamilton, Palmerston North, Napier/Hawke's Bay,
# Nelson, Invercargill, Rotorua, Tauranga]
]
POWER_STATIONS = [
# name, type, lon, lat, capacity_mw, operator
# [data omitted for brevity — 22 stations including hydro (Manapouri,
# Clyde, Roxburgh, Benmore, Aviemore, Ohau A/B/C, Tekapo A/B, Waitaki),
# geothermal (Wairakei, Kawerau, Ngatamariki, Nga Awa Purua, Rotokawa),
# gas/coal (Huntly, Stratford), wind (Te Apiti, Tararua, White Hill,
# Mahinerangi, Hauauru ma Raro, West Wind), and grid hub (Haywards
# Substation)]
]
HOSPITALS = [
# name, city, lon, lat, beds, trauma_level, helipad
# [data omitted for brevity — 12 hospitals: Auckland City, Middlemore,
# Waikato, Wellington Regional, Christchurch, Dunedin, Palmerston North,
# Hawke's Bay Regional, Nelson, Taranaki Base, Hutt Hospital,
# Kenepuru Hospital]
]
INDUSTRIAL_SITES = [
# name, type, lon, lat, output, strategic_importance
# [data omitted for brevity — 10 sites: NZ Steel (Glenbrook), Tiwai Point
# Aluminium, Methanex Motunui, Refining NZ / Marsden Pt, Fonterra
# Edgecumbe, Fonterra Tirau, Alliance Group Lorneville, Silver Fern
# Farms Pareora, Seaview/Gracefield, CentrePort container terminal]
]
# ---------------------------------------------------------------------------
# Haversine distance
# ---------------------------------------------------------------------------
def haversine(lon1, lat1, lon2, lat2):
"""Return great-circle distance in kilometres."""
R = 6371.0
phi1, phi2 = math.radians(lat1), math.radians(lat2)
dphi = math.radians(lat2 - lat1)
dlambda = math.radians(lon2 - lon1)
a = math.sin(dphi / 2) ** 2 + math.cos(phi1) * math.cos(phi2) * math.sin(dlambda / 2) ** 2
return 2 * R * math.asin(math.sqrt(a))
# ---------------------------------------------------------------------------
# Markdown table helpers
# ---------------------------------------------------------------------------
def md_table(headers, rows):
"""Render a markdown table from headers list and list-of-lists rows."""
col_widths = [len(h) for h in headers]
for row in rows:
for i, cell in enumerate(row):
col_widths[i] = max(col_widths[i], len(str(cell)))
def fmt_row(cells):
return "| " + " | ".join(str(c).ljust(col_widths[i]) for i, c in enumerate(cells)) + " |"
sep = "| " + " | ".join("-" * w for w in col_widths) + " |"
lines = [fmt_row(headers), sep] + [fmt_row(r) for r in rows]
return "\n".join(lines)
# ---------------------------------------------------------------------------
# Generate markdown content
# ---------------------------------------------------------------------------
def build_markdown():
lines = []
lines.append("# Doc #016: Infrastructure Atlas — Data Tables")
lines.append("")
lines.append(
"This document provides reference tables for New Zealand's critical infrastructure. "
"Coordinates are WGS84 (decimal degrees). All data current to 2023–2024 unless noted."
)
lines.append("")
lines.append("Maps: [NZ Infrastructure Overview](images/infrastructure-nz.png) | "
"[Wellington Region Detail](images/infrastructure-wellington.png)")
lines.append("")
# ------------------------------------------------------------------
# 1. Major Cities
# ------------------------------------------------------------------
lines.append("## 1. Major Cities")
lines.append("")
lines.append(
"Source: Stats NZ 2023 Census usually-resident population counts. "
"Elevation is approximate urban core elevation (metres above mean sea level)."
)
lines.append("")
headers = ["City", "Population (2023)", "Longitude", "Latitude", "Region", "Elevation (m)"]
rows = []
for name, pop, lon, lat, region, elev in CITIES:
rows.append([name, f"{pop:,}", f"{lon:.4f}", f"{lat:.4f}", region, elev])
lines.append(md_table(headers, rows))
lines.append("")
# ------------------------------------------------------------------
# 2. Ports
# ------------------------------------------------------------------
lines.append("## 2. Commercial Ports")
lines.append("")
lines.append(
"Throughput figures are approximate annual averages (2022–2023). "
"TEU = twenty-foot equivalent unit (containerised cargo). "
"Max vessel size reflects current regular callers."
)
lines.append("")
headers = ["Port", "Longitude", "Latitude", "Throughput", "Unit", "Max Vessel", "Key Exports / Notes"]
rows = []
for name, lon, lat, thru, unit, vessel, exports in PORTS:
rows.append([name, f"{lon:.4f}", f"{lat:.4f}", f"{thru:,}", unit, vessel, exports])
lines.append(md_table(headers, rows))
lines.append("")
lines.append(
"**Note:** Port of Tauranga is New Zealand's largest port by volume. "
"Marsden Point ceased refining in 2022 and now operates as an import terminal."
)
lines.append("")
# ------------------------------------------------------------------
# 3. Airports
# ------------------------------------------------------------------
lines.append("## 3. Airports")
lines.append("")
lines.append(
"Runway length is the longest paved runway. ICAO codes follow standard "
"NZ prefix 'NZ'. International airports hold ICAO-certified customs and biosecurity facilities."
)
lines.append("")
headers = ["Name", "ICAO", "Longitude", "Latitude", "Runway (m)", "Surface", "Capabilities"]
rows = []
for name, icao, lon, lat, rwy, surf, caps in AIRPORTS:
rows.append([name, icao, f"{lon:.4f}", f"{lat:.4f}", rwy, surf, caps])
lines.append(md_table(headers, rows))
lines.append("")
# ------------------------------------------------------------------
# 4. Power Generation
# ------------------------------------------------------------------
lines.append("## 4. Power Generation")
lines.append("")
lines.append(
"Installed capacity in megawatts (MW). New Zealand generates approximately "
"80–85% of electricity from renewable sources in a normal year. "
"Hydro is dominant; geothermal provides reliable baseload; gas/coal (Huntly) "
"is used for dry-year backup. Wind is growing rapidly."
)
lines.append("")
headers = ["Station", "Type", "Longitude", "Latitude", "Capacity (MW)", "Operator"]
rows = []
for name, ptype, lon, lat, cap, op in POWER_STATIONS:
rows.append([name, ptype, f"{lon:.4f}", f"{lat:.4f}", cap, op])
lines.append(md_table(headers, rows))
lines.append("")
lines.append(
"**Waitaki chain** comprises: Waitaki, Aviemore, Benmore, Ohau A/B/C, Tekapo A/B — "
"combined capacity approximately 1,620 MW. Loss of this chain would be a national crisis."
)
lines.append("")
# ------------------------------------------------------------------
# 5. Hospitals
# ------------------------------------------------------------------
lines.append("## 5. Major Hospitals")
lines.append("")
lines.append(
"Bed counts are approximate licensed bed capacity. Trauma levels follow NZ "
"designation: Level 1 = comprehensive tertiary trauma centre; Level 2 = regional trauma centre. "
"All listed hospitals have emergency departments."
)
lines.append("")
headers = ["Hospital", "City", "Longitude", "Latitude", "Beds", "Trauma Level", "Helipad"]
rows = []
for name, city, lon, lat, beds, trauma, heli in HOSPITALS:
rows.append([name, city, f"{lon:.4f}", f"{lat:.4f}", beds, trauma, "Yes" if heli else "No"])
lines.append(md_table(headers, rows))
lines.append("")
# ------------------------------------------------------------------
# 6. Key Industrial Sites
# ------------------------------------------------------------------
lines.append("## 6. Key Industrial Sites")
lines.append("")
lines.append(
"Sites selected for strategic importance in a recovery context: "
"unique capabilities, large-scale output, or no domestic substitute."
)
lines.append("")
headers = ["Site", "Type", "Longitude", "Latitude", "Output", "Strategic Importance"]
rows = []
for name, itype, lon, lat, output, importance in INDUSTRIAL_SITES:
rows.append([name, itype, f"{lon:.4f}", f"{lat:.4f}", output, importance])
lines.append(md_table(headers, rows))
lines.append("")
lines.append(
"**NZ Steel (Glenbrook):** Uses North Island ironsands via direct reduction — unique "
"process not requiring coking coal. Produces reinforcing bar, rod, and structural sections. "
"Loss would eliminate domestic steel production.\n\n"
"**Tiwai Point:** Consumes ~13% of national electricity generation. Closure would "
"dramatically alter the South Island power balance and affect Meridian Energy revenue."
)
lines.append("")
# ------------------------------------------------------------------
# 7. Distance / Bearing Matrix
# ------------------------------------------------------------------
lines.append("## 7. Inter-City Distance Matrix")
lines.append("")
lines.append(
"Great-circle (Haversine) distances in kilometres between major cities. "
"Road distances will be 10–40% longer due to terrain. "
"Half-matrix shown (upper triangle only)."
)
lines.append("")
n = len(CITIES)
city_names = [c[0] for c in CITIES]
city_coords = [(c[2], c[3]) for c in CITIES]
# Header row: abbreviated names for readability
abbr = [
"AKL", "HAM", "TRG", "WLG", "CHC", "DUN",
"NPE", "PMR", "NSN", "NPL", "IVC", "ROT", "WHG", "QTN",
"LHT", "UHT", "POR", "KAP",
]
# Build table as half-matrix
# Row i shows distances from city i to cities i+1..n-1
# We'll display it as a full grid with "—" on diagonal and lower triangle blank
header_cells = ["City"] + abbr
matrix_rows = []
for i in range(n):
row = [city_names[i]]
for j in range(n):
if j < i:
row.append("")
elif j == i:
row.append("—")
else:
d = haversine(city_coords[i][0], city_coords[i][1],
city_coords[j][0], city_coords[j][1])
row.append(f"{d:.0f}")
matrix_rows.append(row)
lines.append(md_table(header_cells, matrix_rows))
lines.append("")
lines.append(
"**Key distances:** Auckland–Wellington 493 km (direct); "
"Wellington–Christchurch 300 km (Cook Strait crossing); "
"Auckland–Christchurch 744 km; Christchurch–Invercargill 433 km."
)
lines.append("")
# ------------------------------------------------------------------
# Map references
# ------------------------------------------------------------------
lines.append("## Maps")
lines.append("")
lines.append("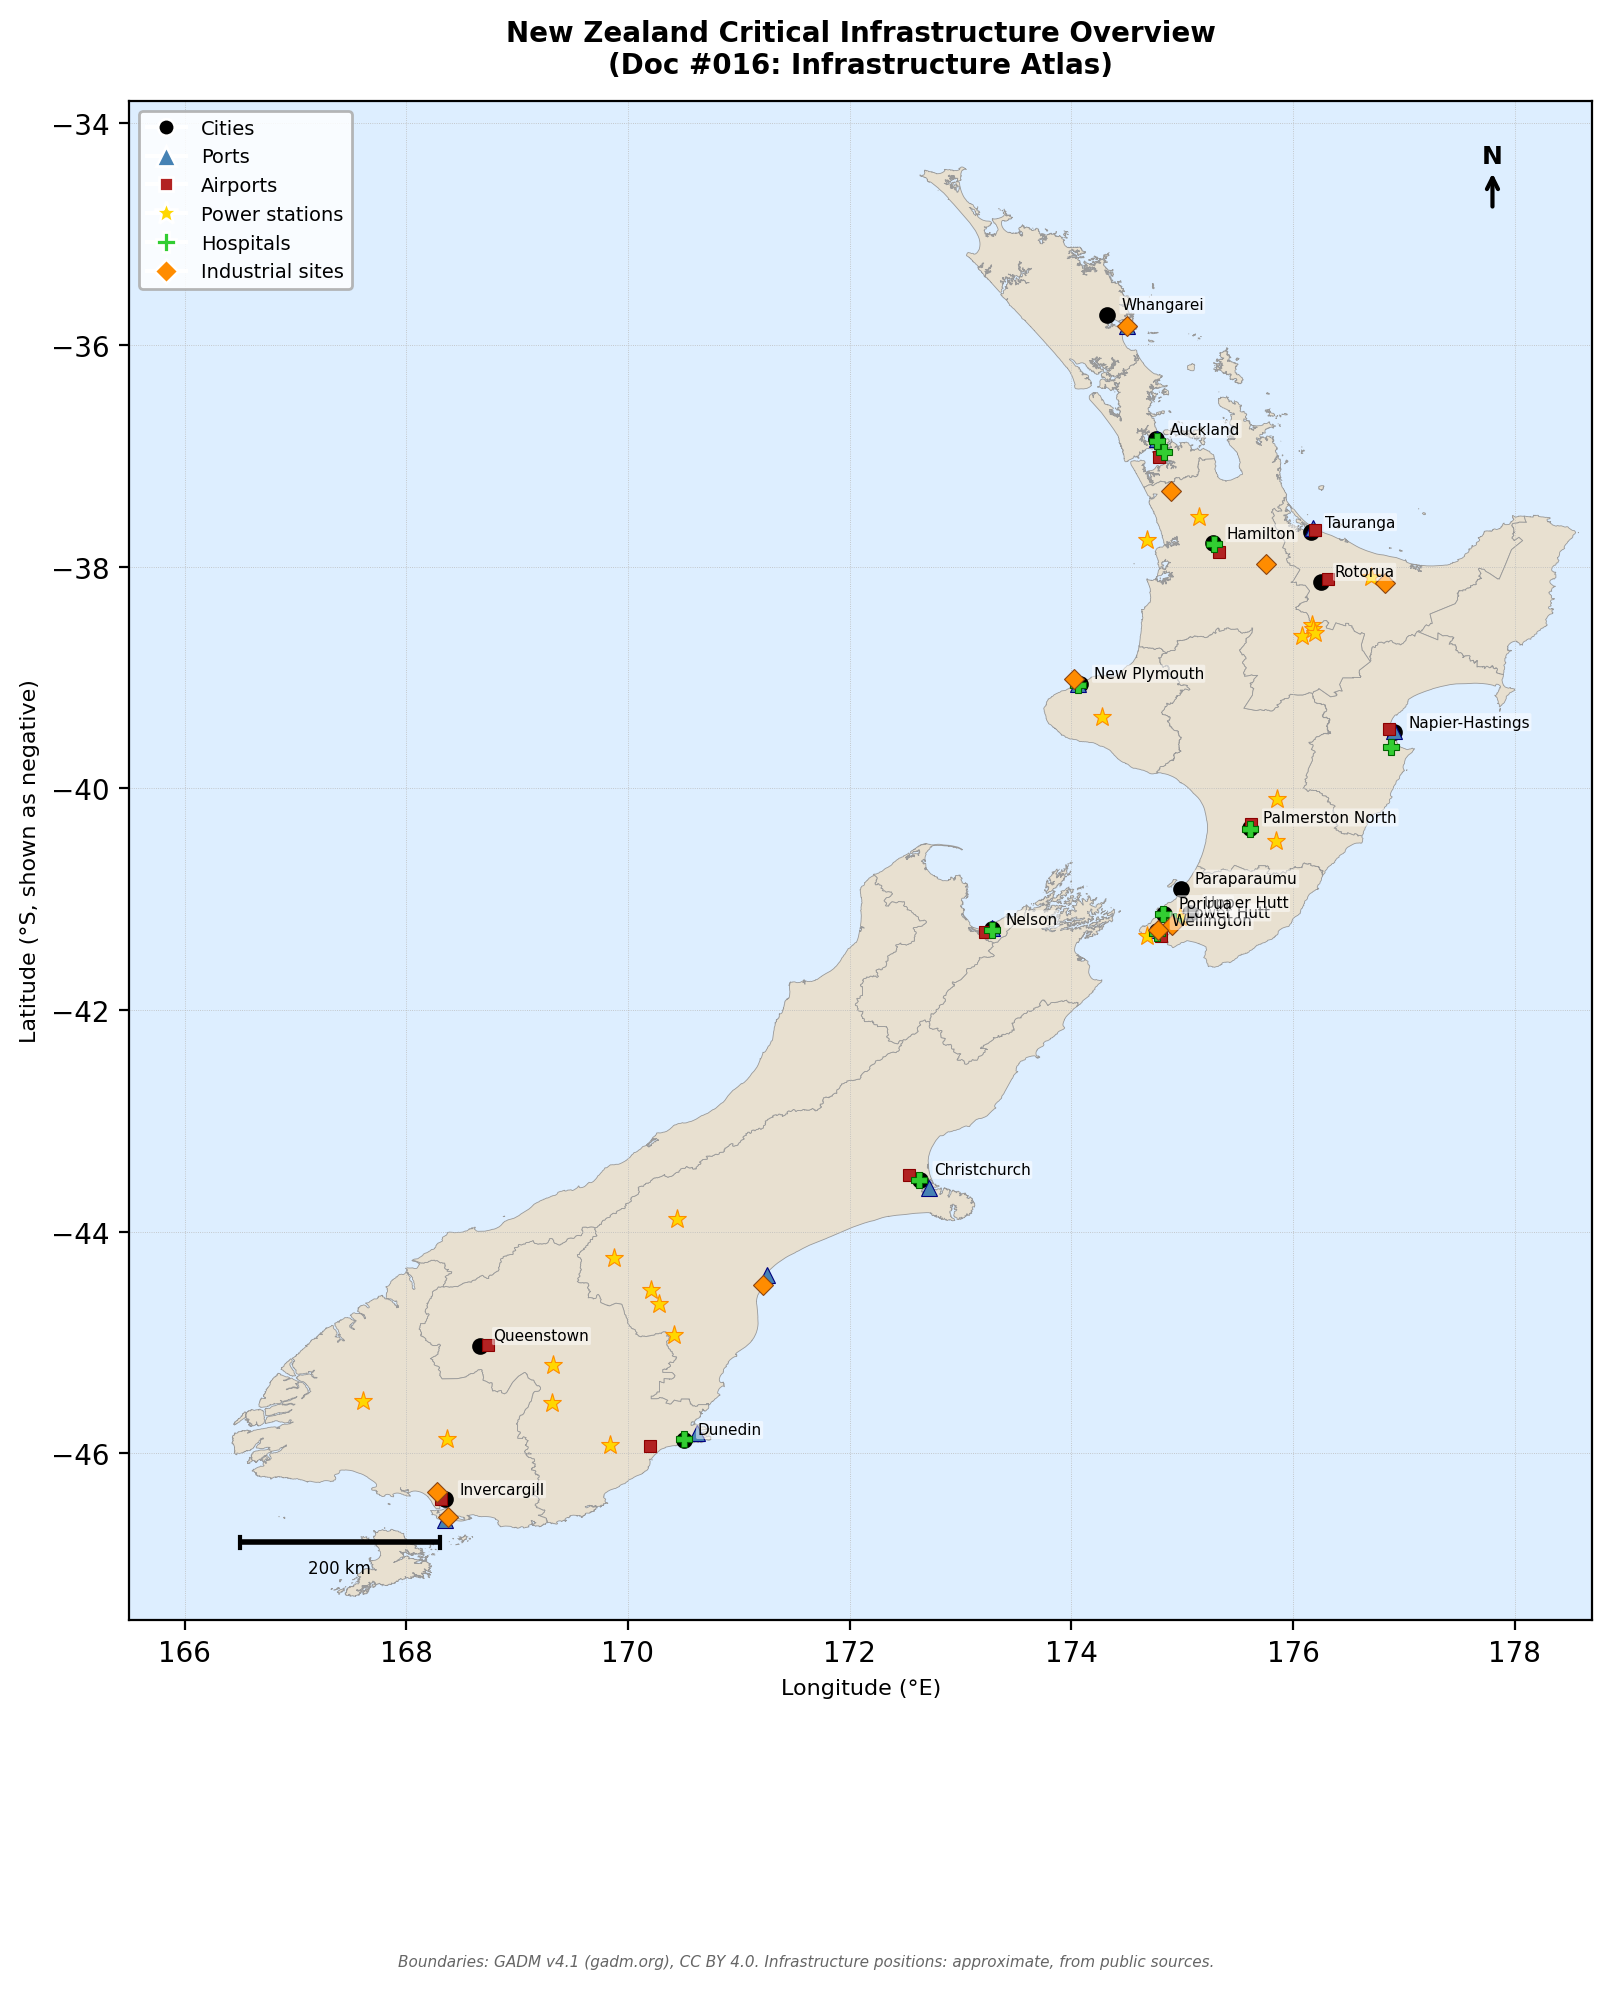")
lines.append("")
lines.append("*Figure 1: Full New Zealand infrastructure overview. "
"Cities (black dots), ports (blue triangles), airports (red squares), "
"power stations (yellow stars), hospitals (green crosses), "
"industrial sites (orange diamonds).*")
lines.append("")
lines.append("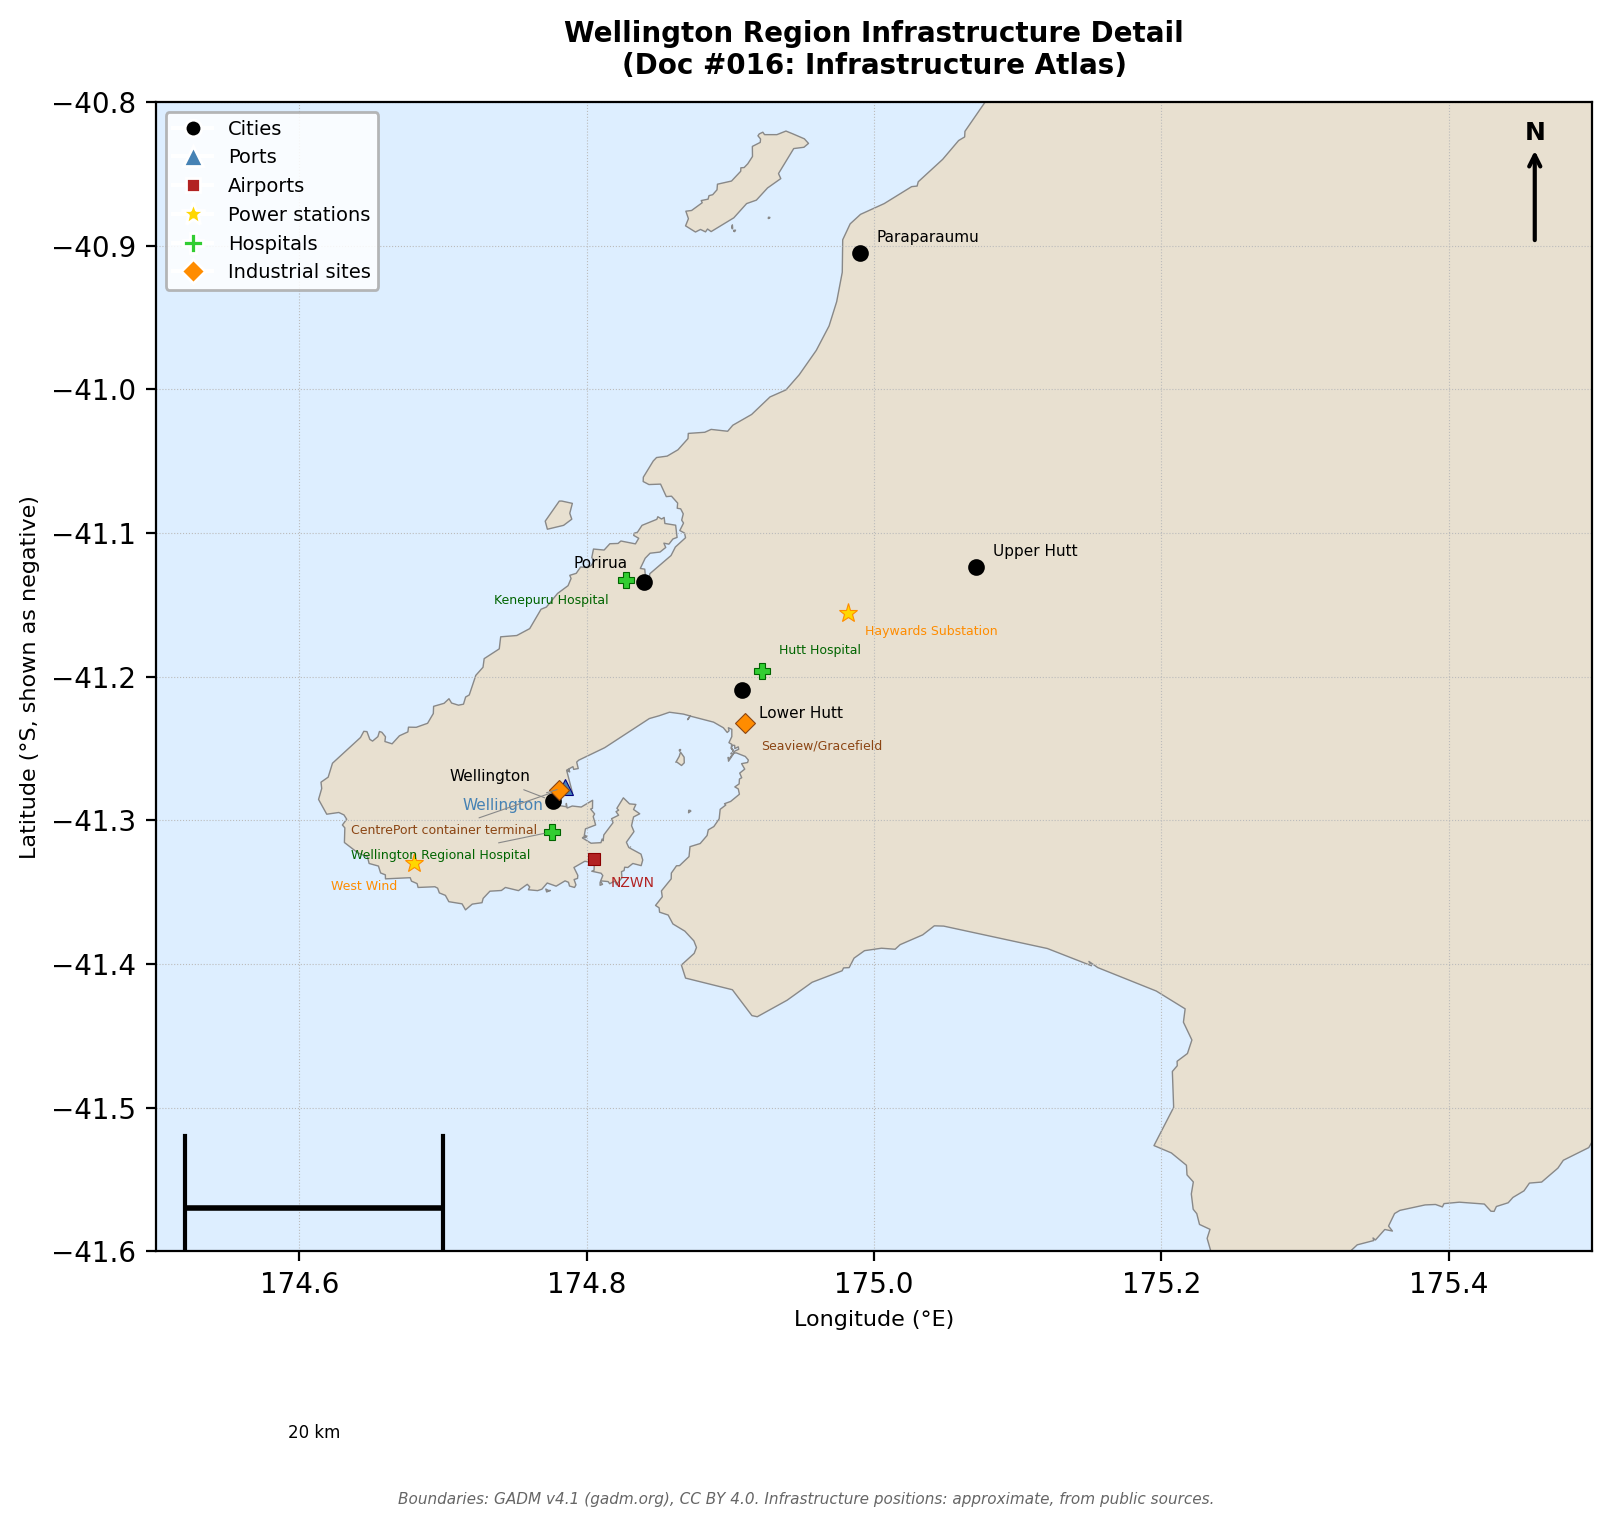")
lines.append("")
lines.append("*Figure 2: Wellington region infrastructure detail.*")
lines.append("")
return "\n".join(lines)
# ---------------------------------------------------------------------------
# Map drawing
# ---------------------------------------------------------------------------
def load_coastline(path):
"""Load NZ coastline JSON — list of segments, each [[lon,lat],...]."""
with open(path) as f:
return json.load(f)
def draw_coastline(ax, segments, color="#888888", lw=0.6):
for seg in segments:
if len(seg) < 2:
continue
lons = [pt[0] for pt in seg]
lats = [pt[1] for pt in seg]
ax.plot(lons, lats, color=color, linewidth=lw, zorder=2)
# Regions to skip from GADM data (remote islands far from main NZ landmass)
_GADM_SKIP_REGIONS = {"ChathamIslands", "NorthernIslands", "SouthernIslands"}
def load_gadm_regions(path):
"""Load GADM Level 1 GeoJSON and return list of (name, polygons) tuples.
Each entry's polygons is a list of polygon rings, where each ring is
a list of (lon, lat) tuples. MultiPolygon features are flattened so
every polygon appears as a separate ring list.
"""
with open(path) as f:
data = json.load(f)
regions = []
for feat in data["features"]:
name = feat["properties"]["NAME_1"]
if name in _GADM_SKIP_REGIONS:
continue
geom = feat["geometry"]
polys = []
if geom["type"] == "MultiPolygon":
for multi_part in geom["coordinates"]:
for ring in multi_part:
polys.append(ring)
elif geom["type"] == "Polygon":
for ring in geom["coordinates"]:
polys.append(ring)
regions.append((name, polys))
return regions
def draw_gadm_regions(ax, regions, facecolor="#e8e0d0", edgecolor="#999999",
linewidth=0.3, zorder=1):
"""Draw GADM region polygons as filled patches on *ax*."""
from matplotlib.patches import Polygon as MplPolygon
from matplotlib.collections import PatchCollection
patches = []
for _name, polys in regions:
for ring in polys:
xy = [(pt[0], pt[1]) for pt in ring]
patches.append(MplPolygon(xy, closed=True))
pc = PatchCollection(patches, facecolor=facecolor, edgecolor=edgecolor,
linewidth=linewidth, zorder=zorder)
ax.add_collection(pc)
# ---------------------------------------------------------------------------
# Wellington detail map — manual label offsets to prevent overlap
# ---------------------------------------------------------------------------
# Each key is (category, name/icao) and the value is a dict with:
# dx, dy — xytext offset in points
# ha, va — horizontal/vertical alignment
# leader — if True, draw a thin leader line from label to marker
#
# Categories: "city", "port", "airport", "power", "hospital", "industrial"
_WLG_LABEL_OFFSETS = {
# [data omitted for brevity — manual label offset dicts for Wellington
# city cluster (Wellington, port, CentrePort, hospital, airport, West Wind),
# Hutt Valley cluster (Lower Hutt, Hutt Hospital, Seaview/Gracefield),
# Porirua/Haywards cluster (Porirua, Kenepuru Hospital, Haywards Substation),
# isolated points (Upper Hutt, Paraparaumu),
# and wind stations (Te Apiti Wind, Tararua Wind)]
}
def _wlg_annotate(ax, label, xy, category, name_key, color, fontsize):
"""Annotate a point on the Wellington detail map using manual offsets."""
key = (category, name_key)
cfg = _WLG_LABEL_OFFSETS.get(key)
if cfg is None:
# Fallback: default offset to upper-right, no leader
cfg = {"dx": 5, "dy": 3, "ha": "left", "va": "bottom", "leader": False}
arrowprops = None
if cfg["leader"]:
arrowprops = dict(arrowstyle="-", color="#888888", lw=0.4,
shrinkA=0, shrinkB=3)
ax.annotate(label, xy, textcoords="offset points",
xytext=(cfg["dx"], cfg["dy"]),
fontsize=fontsize, color=color, zorder=6,
ha=cfg["ha"], va=cfg["va"],
arrowprops=arrowprops)
def plot_infrastructure(ax, label_points=False, lon_range=None, lat_range=None,
fontsize=6, wlg_detail=False):
"""
Plot all infrastructure categories onto ax.
If label_points=True, annotate each point with its name.
If wlg_detail=True, use manually tuned per-label offsets (Wellington map).
lon_range / lat_range used only to determine annotation offsets.
"""
label_fs = 5.5 if wlg_detail else fontsize
# --- Cities ---
for name, pop, lon, lat, region, elev in CITIES:
ax.plot(lon, lat, 'o', color='black', markersize=5, zorder=5)
if label_points:
if wlg_detail:
_wlg_annotate(ax, name, (lon, lat), "city", name,
'black', label_fs)
else:
ax.annotate(name, (lon, lat), textcoords="offset points",
xytext=(4, 2), fontsize=fontsize, color='black', zorder=6)
# --- Ports ---
for name, lon, lat, thru, unit, vessel, exports in PORTS:
ax.plot(lon, lat, '^', color='steelblue', markersize=6, zorder=5,
markeredgecolor='navy', markeredgewidth=0.4)
if label_points:
if wlg_detail:
_wlg_annotate(ax, name, (lon, lat), "port", name,
'steelblue', label_fs)
else:
ax.annotate(name, (lon, lat), textcoords="offset points",
xytext=(4, -6), fontsize=fontsize, color='steelblue', zorder=6)
# --- Airports ---
for name, icao, lon, lat, rwy, surf, caps in AIRPORTS:
ax.plot(lon, lat, 's', color='firebrick', markersize=4, zorder=5,
markeredgecolor='darkred', markeredgewidth=0.4)
if label_points:
if wlg_detail:
_wlg_annotate(ax, icao, (lon, lat), "airport", icao,
'firebrick', label_fs - 0.5)
else:
ax.annotate(icao, (lon, lat), textcoords="offset points",
xytext=(4, 3), fontsize=fontsize - 0.5, color='firebrick', zorder=6)
# --- Power stations ---
for name, ptype, lon, lat, cap, op in POWER_STATIONS:
ax.plot(lon, lat, '*', color='gold', markersize=7, zorder=5,
markeredgecolor='darkorange', markeredgewidth=0.4)
if label_points:
if wlg_detail:
_wlg_annotate(ax, name, (lon, lat), "power", name,
'darkorange', label_fs - 1)
else:
ax.annotate(name, (lon, lat), textcoords="offset points",
xytext=(4, -4), fontsize=fontsize - 1, color='darkorange', zorder=6)
# --- Hospitals ---
for name, city, lon, lat, beds, trauma, heli in HOSPITALS:
ax.plot(lon, lat, 'P', color='limegreen', markersize=6, zorder=5,
markeredgecolor='darkgreen', markeredgewidth=0.4)
if label_points:
if wlg_detail:
_wlg_annotate(ax, name, (lon, lat), "hospital", name,
'darkgreen', label_fs - 1)
else:
ax.annotate(name, (lon, lat), textcoords="offset points",
xytext=(4, 1), fontsize=fontsize - 1, color='darkgreen', zorder=6)
# --- Industrial sites ---
for name, itype, lon, lat, output, importance in INDUSTRIAL_SITES:
ax.plot(lon, lat, 'D', color='darkorange', markersize=5, zorder=5,
markeredgecolor='saddlebrown', markeredgewidth=0.4)
if label_points:
if wlg_detail:
_wlg_annotate(ax, name, (lon, lat), "industrial", name,
'saddlebrown', label_fs - 1)
else:
ax.annotate(name, (lon, lat), textcoords="offset points",
xytext=(4, -3), fontsize=fontsize - 1, color='saddlebrown', zorder=6)
def add_legend(ax, fontsize=7):
import matplotlib.lines as mlines
handles = [
mlines.Line2D([], [], marker='o', color='w', markerfacecolor='black',
markersize=6, label='Cities'),
mlines.Line2D([], [], marker='^', color='w', markerfacecolor='steelblue',
markersize=7, label='Ports'),
mlines.Line2D([], [], marker='s', color='w', markerfacecolor='firebrick',
markersize=5, label='Airports'),
mlines.Line2D([], [], marker='*', color='w', markerfacecolor='gold',
markersize=9, label='Power stations'),
mlines.Line2D([], [], marker='P', color='w', markerfacecolor='limegreen',
markersize=7, label='Hospitals'),
mlines.Line2D([], [], marker='D', color='w', markerfacecolor='darkorange',
markersize=6, label='Industrial sites'),
]
ax.legend(handles=handles, loc='lower left', fontsize=fontsize,
framealpha=0.85, edgecolor='#aaaaaa')
def add_scale_bar(ax, lon_left, lat_bottom, km=200):
"""Draw an approximate scale bar. 1 degree lat ≈ 111 km."""
deg = km / 111.0
ax.plot([lon_left, lon_left + deg], [lat_bottom, lat_bottom],
color='black', linewidth=2, solid_capstyle='butt', zorder=7)
ax.plot([lon_left, lon_left], [lat_bottom - 0.05, lat_bottom + 0.05],
color='black', linewidth=1.5, zorder=7)
ax.plot([lon_left + deg, lon_left + deg], [lat_bottom - 0.05, lat_bottom + 0.05],
color='black', linewidth=1.5, zorder=7)
ax.text(lon_left + deg / 2, lat_bottom - 0.15, f"{km} km",
ha='center', va='top', fontsize=6, zorder=7)
def generate_nz_map(coastline_path, output_path, gadm_path=None):
import matplotlib
matplotlib.use('Agg')
import matplotlib.pyplot as plt
fig, ax = plt.subplots(figsize=(8, 11), dpi=200)
fig.patch.set_facecolor('white')
ax.set_facecolor('#ddeeff') # light blue ocean
# Base layer: GADM regional boundaries (preferred) or coastline fallback
if gadm_path and os.path.isfile(gadm_path):
regions = load_gadm_regions(gadm_path)
draw_gadm_regions(ax, regions, facecolor="#e8e0d0", edgecolor="#999999",
linewidth=0.3, zorder=1)
else:
segments = load_coastline(coastline_path)
draw_coastline(ax, segments)
plot_infrastructure(ax, label_points=False)
# City name labels (not cluttered — just cities)
for name, pop, lon, lat, region, elev in CITIES:
ax.annotate(name, (lon, lat), textcoords="offset points",
xytext=(5, 2), fontsize=5.5, color='black', zorder=6,
bbox=dict(boxstyle='round,pad=0.1', fc='white', alpha=0.5, ec='none'))
add_legend(ax, fontsize=7)
add_scale_bar(ax, lon_left=166.5, lat_bottom=-46.8, km=200)
ax.set_xlim(165.5, 178.7)
ax.set_ylim(-47.5, -33.8)
ax.set_xlabel("Longitude (°E)", fontsize=8)
ax.set_ylabel("Latitude (°S, shown as negative)", fontsize=8)
ax.set_title("New Zealand Critical Infrastructure Overview\n(Doc #016: Infrastructure Atlas)",
fontsize=10, fontweight='bold', pad=10)
ax.set_aspect('equal')
ax.grid(True, color='#bbbbbb', linewidth=0.3, linestyle=':', zorder=2)
# Compass rose (simple N arrow)
ax.annotate('N', xy=(177.8, -34.4), fontsize=9, ha='center', va='bottom', fontweight='bold')
ax.annotate('', xy=(177.8, -34.4), xytext=(177.8, -34.8),
arrowprops=dict(arrowstyle='->', color='black', lw=1.5))
# Attribution footer
fig.text(0.5, 0.01,
"Boundaries: GADM v4.1 (gadm.org), CC BY 4.0. "
"Infrastructure positions: approximate, from public sources.",
ha="center", fontsize=5.5, color="#666666", style="italic")
plt.tight_layout(pad=0.5, rect=[0, 0.025, 1, 1])
os.makedirs(os.path.dirname(output_path), exist_ok=True)
fig.savefig(output_path, dpi=200, bbox_inches='tight', facecolor='white')
plt.close(fig)
print(f" Saved: {output_path}")
def generate_wellington_map(coastline_path, output_path, gadm_path=None):
import matplotlib
matplotlib.use('Agg')
import matplotlib.pyplot as plt
# Wellington region bounding box
LON_MIN, LON_MAX = 174.5, 175.5
LAT_MIN, LAT_MAX = -41.6, -40.8
fig, ax = plt.subplots(figsize=(8, 8), dpi=200)
fig.patch.set_facecolor('white')
ax.set_facecolor('#ddeeff')
# Use GADM boundaries for detailed coastline (harbours, bays, peninsulas)
if gadm_path and os.path.isfile(gadm_path):
regions = load_gadm_regions(gadm_path)
draw_gadm_regions(ax, regions, facecolor="#e8e0d0", edgecolor="#888888",
linewidth=0.5, zorder=1)
else:
segments = load_coastline(coastline_path)
draw_coastline(ax, segments, color='#666666', lw=0.8)
plot_infrastructure(ax, label_points=True, fontsize=6.5,
lon_range=(LON_MIN, LON_MAX), lat_range=(LAT_MIN, LAT_MAX),
wlg_detail=True)
add_legend(ax, fontsize=7)
add_scale_bar(ax, lon_left=174.52, lat_bottom=-41.57, km=20)
ax.set_xlim(LON_MIN, LON_MAX)
ax.set_ylim(LAT_MIN, LAT_MAX)
ax.set_xlabel("Longitude (°E)", fontsize=8)
ax.set_ylabel("Latitude (°S, shown as negative)", fontsize=8)
ax.set_title("Wellington Region Infrastructure Detail\n(Doc #016: Infrastructure Atlas)",
fontsize=10, fontweight='bold', pad=10)
ax.set_aspect('equal')
ax.grid(True, color='#bbbbbb', linewidth=0.4, linestyle=':', zorder=1)
ax.annotate('N', xy=(175.46, -40.83), fontsize=9, ha='center', va='bottom', fontweight='bold')
ax.annotate('', xy=(175.46, -40.83), xytext=(175.46, -40.90),
arrowprops=dict(arrowstyle='->', color='black', lw=1.5))
# Attribution footer
fig.text(0.5, 0.01,
"Boundaries: GADM v4.1 (gadm.org), CC BY 4.0. "
"Infrastructure positions: approximate, from public sources.",
ha="center", fontsize=5.5, color="#666666", style="italic")
plt.tight_layout(pad=0.5, rect=[0, 0.025, 1, 1])
os.makedirs(os.path.dirname(output_path), exist_ok=True)
fig.savefig(output_path, dpi=200, bbox_inches='tight', facecolor='white')
plt.close(fig)
print(f" Saved: {output_path}")
# ---------------------------------------------------------------------------
# Main
# ---------------------------------------------------------------------------
def main():
script_dir = os.path.dirname(os.path.abspath(__file__))
repo_root = os.path.join(script_dir, "..")
data_dir = os.path.join(script_dir, "data")
coastline_path = os.path.join(data_dir, "nz-coastline.json")
gadm_path = os.path.join(data_dir, "gadm41_NZL_1.json")
md_output = os.path.join(repo_root, "tables-infrastructure.md")
images_dir = os.path.join(repo_root, "site", "images")
map_nz = os.path.join(images_dir, "infrastructure-nz.png")
map_wlg = os.path.join(images_dir, "infrastructure-wellington.png")
# Validate coastline data exists
if not os.path.isfile(coastline_path):
print(f"ERROR: Coastline data not found at {coastline_path}", file=sys.stderr)
sys.exit(1)
# --- Generate markdown ---
print("Generating tables-infrastructure.md ...")
md_content = build_markdown()
with open(md_output, "w", encoding="utf-8") as f:
f.write(md_content)
print(f" Saved: {md_output}")
# --- Generate maps ---
try:
import matplotlib
except ImportError:
print("ERROR: matplotlib not installed. Run: pip install matplotlib", file=sys.stderr)
sys.exit(1)
print("Generating infrastructure-nz.png ...")
generate_nz_map(coastline_path, map_nz, gadm_path=gadm_path)
print("Generating infrastructure-wellington.png ...")
generate_wellington_map(coastline_path, map_wlg, gadm_path=gadm_path)
print("Done.")
if __name__ == "__main__":
main()Data Sources
- Stats NZ 2023 Census — usually-resident population counts for city populations.
- Port company annual reports (2022–2023) — throughput figures for all listed ports (Ports of Auckland, Port of Tauranga, Lyttelton Port Company, Napier Port, CentrePort Wellington, Port Otago, Southport, Nelson Port, Port Taranaki, South Port).
- NZTA / Airways NZ — airport runway lengths and ICAO designations.
- Electricity Authority / generator annual reports — installed capacity figures for Meridian Energy, Contact Energy, Genesis Energy, Mercury NZ, and Todd Energy.
- Health New Zealand / Te Whatu Ora — hospital bed counts and trauma level designations.
- Company statutory disclosures — NZ Steel, Tiwai Point (Rio Tinto), Methanex, Fonterra, Alliance Group, Silver Fern Farms, CentrePort production/throughput figures.
- GADM v4.1 (Database of Global Administrative
Areas) —
scripts/data/gadm41_NZL_1.json, Level 1 administrative boundaries for New Zealand used to render filled-polygon land areas with regional borders on the maps. Source: gadm.org. - NZ coastline geometry (fallback) —
scripts/data/nz-coastline.json(included in repository; sourced from LINZ data service). Used only when GADM data is not available.