This Python script generates the Water Resources data tables used by Doc #028 (Water Resources). It produces six structured reference tables: major rivers with flow rates, catchment sizes, water quality, and flood risk; major lakes with area, depth, volume, and uses; hydroelectric dams with installed capacity and annual generation; municipal water sources for the 10 largest cities with backup sources, treatment methods, and vulnerability assessments; major aquifers with recharge rates and allocation status; and a water budget summary by region with per-capita availability estimates. It also generates a map of New Zealand using GADM v4.1 Level 1 regional boundaries as the land base layer, overlaid with major rivers, lakes, hydroelectric dams, and municipal water intakes.
Requirements: Python 3.6+ with matplotlib.
Also requires scripts/data/gadm41_NZL_1.json (GADM
v4.1 Level 1 administrative boundaries for New Zealand; included
in the repository).
Usage:
python scripts/generate_water_resources.py
# Default output: tables-water.md + site/images/water-resources.png
Output: - tables-water.md — six
tables with footnotes covering rivers, lakes, dams, municipal
sources, aquifers, and a regional water budget summary -
site/images/water-resources.png — NZ water resources
map showing rivers, lakes, dams, and municipal intakes
Source Code
#!/usr/bin/env python3
"""
generate_water_resources.py
Generates tables-water.md and site/images/water-resources.png for
Recovery Library Doc #028: Water Resources.
Run with: scripts/.venv/bin/python
"""
import json
import os
import sys
from pathlib import Path
import matplotlib
matplotlib.use("Agg")
import matplotlib.pyplot as plt
import matplotlib.patches as mpatches
from matplotlib.lines import Line2D
# ---------------------------------------------------------------------------
# Paths
# ---------------------------------------------------------------------------
SCRIPT_DIR = Path(__file__).parent
DATA_DIR = SCRIPT_DIR / "data"
REPO_ROOT = SCRIPT_DIR.parent
TABLES_OUT = REPO_ROOT / "tables-water.md"
IMAGE_OUT = REPO_ROOT / "site" / "images" / "water-resources.png"
GADM_JSON = DATA_DIR / "gadm41_NZL_1.json"
# Regions to exclude from the map (remote island groups outside main NZ extent)
GADM_SKIP_REGIONS = {"ChathamIslands", "NorthernIslands", "SouthernIslands"}
# ---------------------------------------------------------------------------
# Data
# ---------------------------------------------------------------------------
RIVERS = [
# [data omitted for brevity — 15 rivers with name, length_km, mean_flow_m3s,
# catchment_km2, source, mouth, quality, uses, flood_risk]
]
LAKES = [
# [data omitted for brevity — 13 lakes with name, area_km2, max_depth_m,
# volume_km3, lon, lat, type, quality, uses]
]
DAMS = [
# [data omitted for brevity — 19 dams with name, river, lon, lat,
# capacity_mw, reservoir, annual_gwh, operator]
]
MUNICIPAL_SOURCES = [
# [data omitted for brevity — 10 cities with city, primary_source,
# backup_source, treatment, capacity_ml_day, population, vulnerability]
]
AQUIFERS = [
# [data omitted for brevity — 6 aquifers with name, region, type,
# area_km2, recharge_mm_yr, allocation_pct, quality]
]
WATER_BUDGET = [
# [data omitted for brevity — 11 regions with region, area_km2,
# mean_precip_mm, runoff_mm, pop, per_capita_m3_yr, constraints]
]
# ---------------------------------------------------------------------------
# River approximate paths [lon, lat] for mapping
# ---------------------------------------------------------------------------
RIVER_PATHS = {
# [data omitted for brevity — 12 rivers with approximate coordinate paths]
}
# ---------------------------------------------------------------------------
# Markdown generation
# ---------------------------------------------------------------------------
def md_table(headers, rows, alignments=None):
"""Return a GitHub-flavoured markdown table string."""
if alignments is None:
alignments = ["---"] * len(headers)
lines = []
lines.append("| " + " | ".join(headers) + " |")
lines.append("| " + " | ".join(alignments) + " |")
for row in rows:
lines.append("| " + " | ".join(str(c) for c in row) + " |")
return "\n".join(lines)
def generate_markdown():
lines = []
lines.append("<!-- Auto-generated by scripts/generate_water_resources.py — do not edit by hand -->")
lines.append("")
lines.append("# Water Resources — Data Tables")
lines.append("")
lines.append("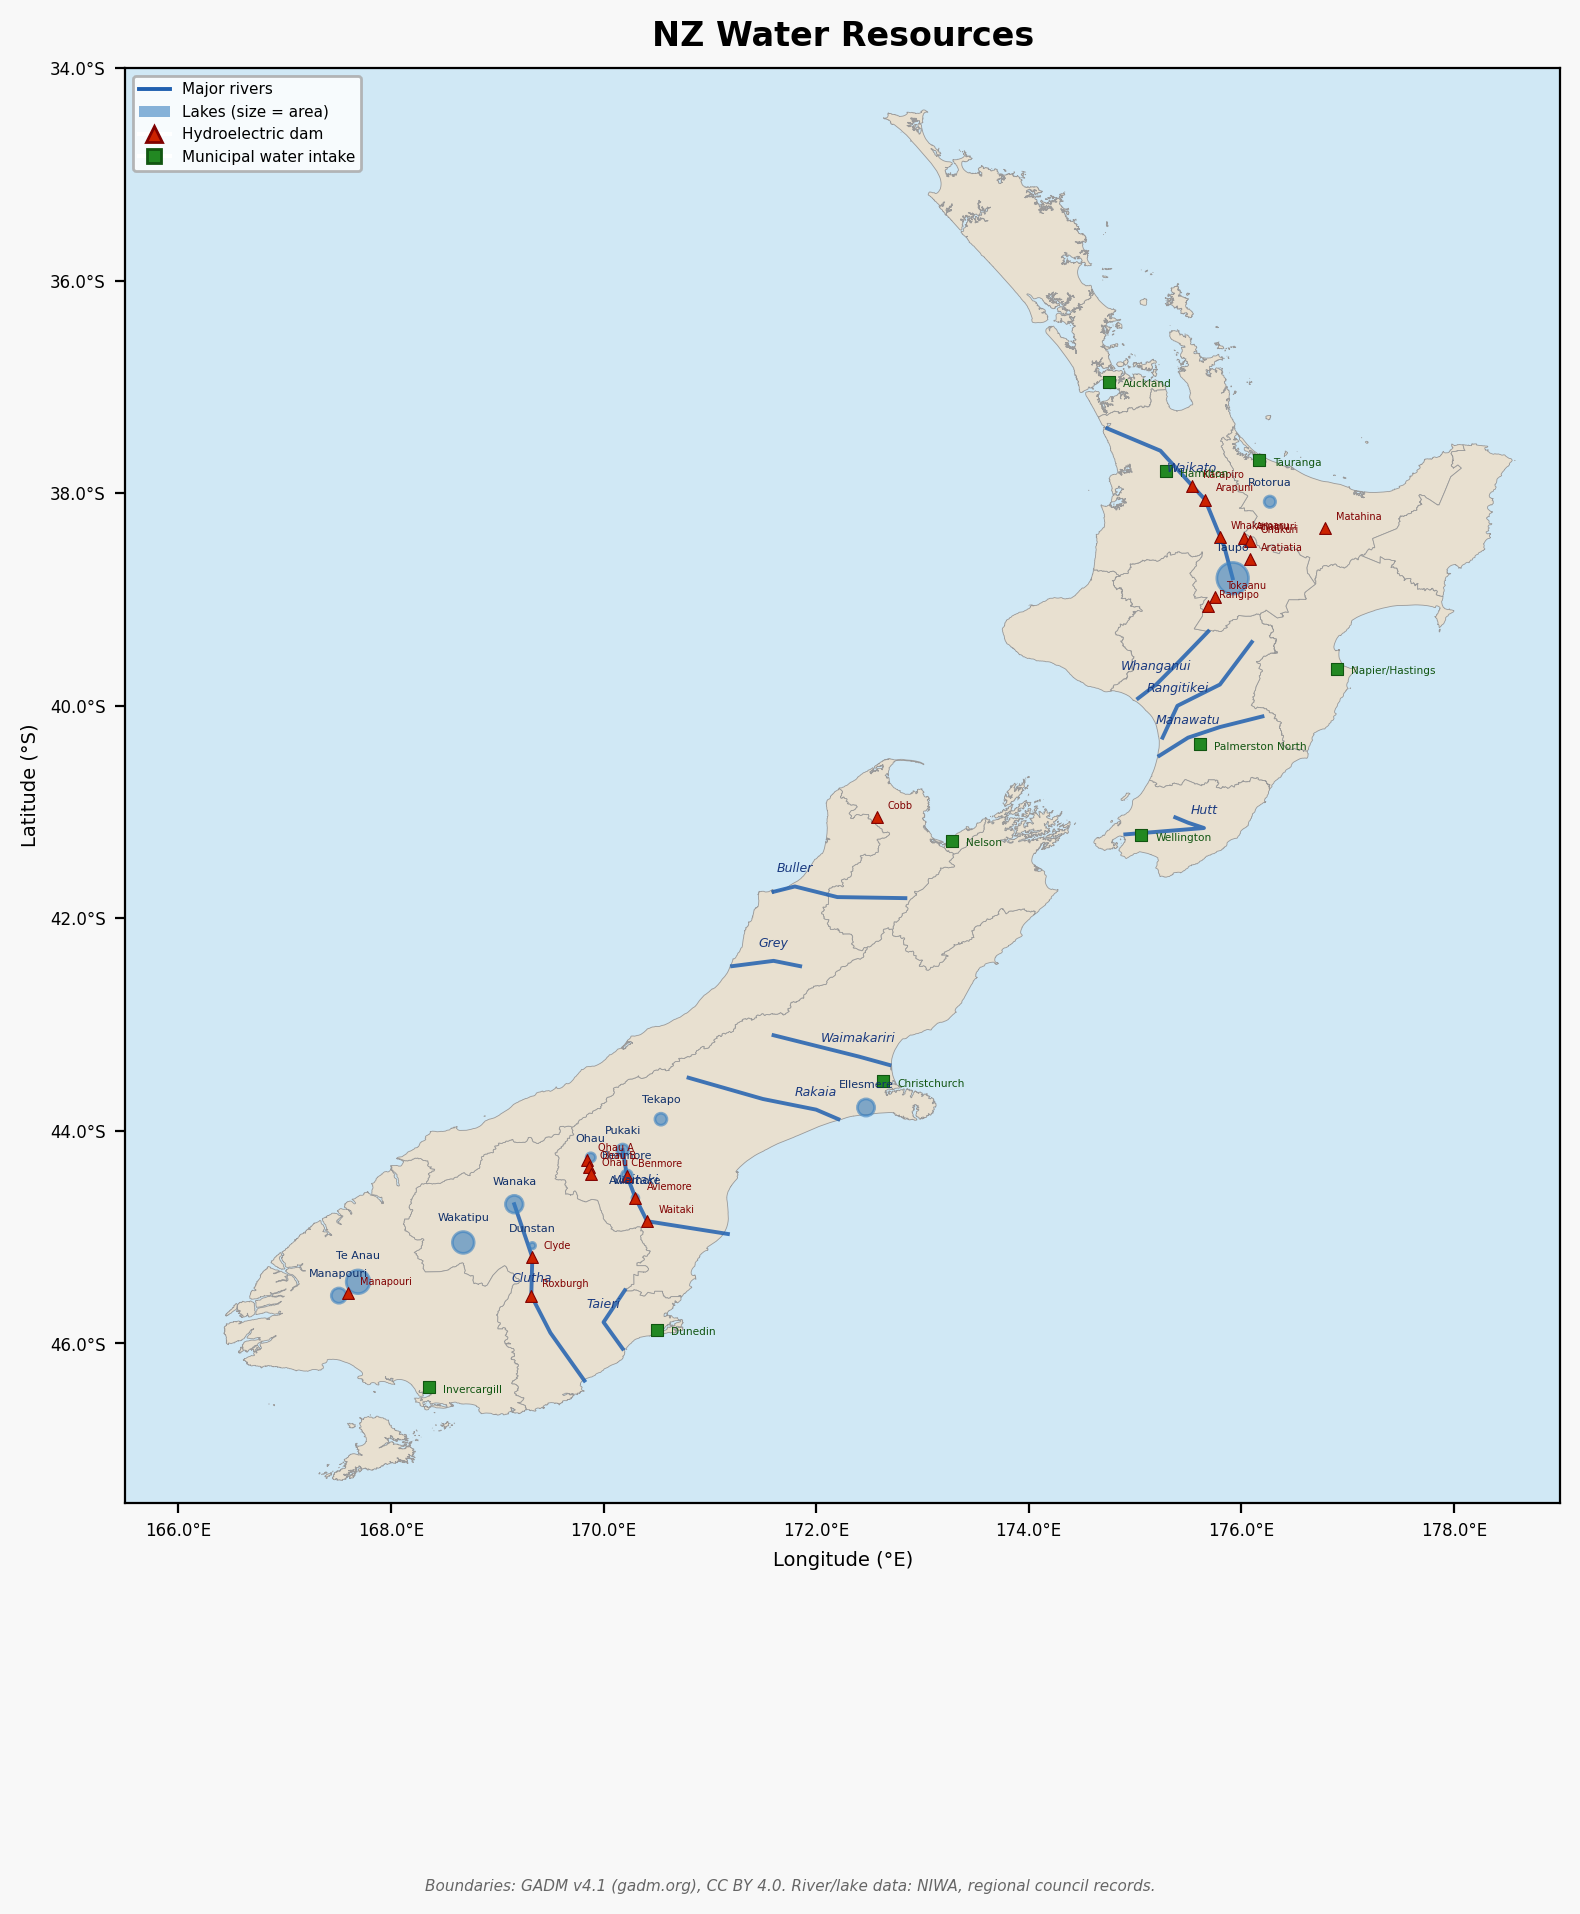")
lines.append("")
lines.append("*Figure 1: Major rivers (blue lines), lakes (blue circles scaled by area), hydroelectric dams (red triangles), and principal municipal water intakes (green squares). Source data: NIWA River Environment Classification; regional council GIS layers.*")
lines.append("")
# --- Table 1: Major Rivers ---
lines.append("## 1. Major Rivers")
lines.append("")
lines.append("Data sources: NIWA River Environment Classification (REC2); Land Cover Database; regional council annual river flow reports.[^1]")
lines.append("")
headers = ["River", "Length (km)", "Mean Flow (m³/s)", "Catchment (km²)", "Source", "Mouth (approx. coordinates)", "Water Quality", "Primary Uses", "Flood Risk"]
rows = [list(r) for r in RIVERS]
lines.append(md_table(headers, rows))
lines.append("")
# --- Table 2: Major Lakes ---
lines.append("## 2. Major Lakes")
lines.append("")
lines.append("Data sources: NIWA Lakes380 database; Land Information New Zealand (LINZ) bathymetry surveys; Meridian/Contact/Genesis Energy reservoir data.[^2]")
lines.append("")
headers = ["Lake", "Area (km²)", "Max Depth (m)", "Volume (km³)", "Longitude", "Latitude", "Type", "Water Quality", "Primary Uses"]
rows = [(n, ar, md, vol, f"{lon:.2f}°E", f"{abs(lat):.2f}°S", tp, q, u)
for n, ar, md, vol, lon, lat, tp, q, u in LAKES]
lines.append(md_table(headers, rows))
lines.append("")
# --- Table 3: Hydroelectric Dams ---
lines.append("## 3. Hydroelectric Dams")
lines.append("")
lines.append("Data sources: Meridian Energy, Contact Energy, Genesis Energy annual reports; Electricity Authority generation data; Ministry of Business, Innovation and Employment (MBIE) energy statistics.[^3]")
lines.append("")
headers = ["Dam", "River", "Longitude", "Latitude", "Capacity (MW)", "Reservoir/Lake", "Annual Generation (GWh)", "Operator"]
rows = [(name, river, f"{lon:.2f}°E", f"{abs(lat):.2f}°S", cap, res, gen, op)
for name, river, lon, lat, cap, res, gen, op in DAMS]
lines.append(md_table(headers, rows))
lines.append("")
total_mw = sum(d[4] for d in DAMS)
total_gwh = sum(d[6] for d in DAMS)
lines.append(f"**Totals listed above:** {total_mw:,} MW installed capacity; ~{total_gwh:,} GWh annual generation (varies with hydrology). NZ total hydro capacity ~5,600 MW, generating approximately 23,000–25,000 GWh/yr (~57% of national electricity).[^3]")
lines.append("")
# --- Table 4: Municipal Water Sources ---
lines.append("## 4. Municipal Water Sources")
lines.append("")
lines.append("Data sources: Taumata Arowai (Water Services Regulator) drinking water register; local authority annual reports; Three Waters review documentation.[^4]")
lines.append("")
headers = ["City / Urban Area", "Primary Source", "Backup Source", "Treatment", "Capacity (ML/day)", "Population Served", "Vulnerability Assessment"]
rows = [(city, pri, bk, tr, f"{cap:,}", f"{pop:,}", vuln)
for city, pri, bk, tr, cap, pop, vuln in MUNICIPAL_SOURCES]
lines.append(md_table(headers, rows))
lines.append("")
lines.append("**Note on infrastructure damage scenarios:** Christchurch's artesian supply is highly resilient to surface contamination but vulnerable to earthquake-induced liquefaction damaging wellheads and mains (as demonstrated in 2011). Wellington's cross-fault mains present the most acute seismic risk nationally — a major Wellington Fault rupture could isolate supply for weeks.[^4]")
lines.append("")
# --- Table 5: Major Aquifers ---
lines.append("## 5. Major Aquifers")
lines.append("")
lines.append("Data sources: GNS Science groundwater databases; regional council allocation registers; MfE National Policy Statement for Freshwater Management 2020.[^5]")
lines.append("")
headers = ["Aquifer", "Region", "Type", "Area (km²)", "Recharge Rate", "Current Allocation", "Water Quality"]
rows = list(AQUIFERS)
lines.append(md_table(headers, rows))
lines.append("")
lines.append("**Allocation note:** Several Canterbury sub-catchments and the Heretaunga Plains are in allocation limit or over-allocation status under the NPS-FM 2020 framework. Aquifer recharge rates in rain-fed systems (Southland, Waikato) are relatively secure under climate projections; rain-shadow Canterbury aquifers recharged by alpine rivers face risk if glacier retreat reduces late-summer flows.[^5]")
lines.append("")
# --- Table 6: Water Budget Summary ---
lines.append("## 6. Water Budget Summary by Region")
lines.append("")
lines.append("Data sources: NIWA Regional Climate Projections; Statistics New Zealand regional population estimates 2024; MfE Environmental Indicators.[^6]")
lines.append("")
headers = ["Region", "Area (km²)", "Mean Precip. (mm/yr)", "Mean Runoff (mm/yr)", "Population (approx.)", "Per-Capita Availability (m³/yr)", "Key Constraints"]
rows = [(r, f"{a:,}", p, ro, f"{pop:,}", f"{pc:,}", c)
for r, a, p, ro, pop, pc, c in WATER_BUDGET]
lines.append(md_table(headers, rows))
lines.append("")
lines.append("### Interpretation")
lines.append("")
lines.append("New Zealand's national per-capita freshwater availability (~84,000 m³/person/year) is among the highest in the world. The binding constraint in most scenarios is **not volume but access**: infrastructure condition, contamination, and distribution energy requirements.")
lines.append("")
lines.append("In a grid-off or infrastructure-damage scenario:")
lines.append("")
lines.append("- **Gravity-fed highland supplies** (Dunedin, Nelson, most alpine communities) are most resilient — flow continues without pumping.")
lines.append("- **Artesian supplies** (Christchurch) flow under natural pressure but require intact wellhead and distribution infrastructure.")
lines.append("- **River intakes requiring treatment** (Hamilton, Palmerston North, Auckland's Waikato backup) depend on powered treatment plants; raw Waikato River water carries Giardia, cyanotoxin, and turbidity risks.")
lines.append("- **Canterbury Plains irrigation** relies on electricity for pump-lift; gravity-canal schemes (Rakaia-Selwyn Irrigation, Central Plains Water) are more resilient.")
lines.append("- **Minimum survival requirement** is approximately 5 L/person/day for drinking; 50 L/day supports basic sanitation. Most NZ stream sources, filtered and treated with household-scale methods (Sawyer PointOne, boiling, UV), can meet survival needs within walking distance of most settlements.[^6]")
lines.append("")
# --- Footnotes ---
lines.append("---")
lines.append("")
lines.append("[^1]: NIWA, *River Environment Classification New Zealand* (REC2), 2010–2022; NIWA flow data portal (https://niwa.co.nz/freshwater); Regional council (Environment Canterbury, Horizons, Greater Wellington) annual river flow reports.")
lines.append("")
lines.append("[^2]: NIWA, *Lakes380 Project*, Waikato University / NIWA, 2021; LINZ bathymetric surveys; Meridian Energy, Contact Energy, Genesis Energy annual reports 2022–2024.")
lines.append("")
lines.append("[^3]: MBIE, *New Zealand Energy Data File 2024*; Electricity Authority, *Generation Data* (EMI portal); Meridian Energy, Contact Energy, Genesis Energy statutory disclosures.")
lines.append("")
lines.append("[^4]: Taumata Arowai, *Drinking Water Quality Register*, 2024; GNS Science, *Active Fault Database* (seismic risk assessments); Wellington Water Ltd, *Infrastructure Strategy 2024–2054*; Christchurch City Council, *Water Supply Strategy 2023*.")
lines.append("")
lines.append("[^5]: GNS Science, *Groundwater Resources of New Zealand*, 2015; MfE, *National Policy Statement for Freshwater Management 2020*; Environment Canterbury, *Water Allocation Data 2023*; Hawke's Bay Regional Council, *Heretaunga Plains Aquifer Review 2022*.")
lines.append("")
lines.append("[^6]: NIWA, *The New Zealand Hydrological Cycle*, 2019; MfE, *Environmental Indicators — Fresh water*, 2022; Statistics NZ, *Subnational Population Estimates*, 2024; WHO, *Minimum Water Requirements in Emergencies*, 2011.")
lines.append("")
return "\n".join(lines)
# ---------------------------------------------------------------------------
# Map generation
# ---------------------------------------------------------------------------
def _draw_gadm_regions(ax, gadm_data):
"""Draw GADM Level 1 region polygons as the land base layer.
Each feature is a MultiPolygon. Structure:
geometry.coordinates -> list of polygons
each polygon -> list of rings (first is exterior, rest are holes)
each ring -> list of [lon, lat] pairs
"""
for feature in gadm_data["features"]:
region_name = feature["properties"].get("NAME_1", "")
if region_name in GADM_SKIP_REGIONS:
continue
geom = feature["geometry"]
# MultiPolygon: coordinates is a list of polygons
for polygon in geom["coordinates"]:
# polygon[0] is the exterior ring; polygon[1:] are holes (rare for
# this dataset at Level 1 but handled correctly).
exterior = polygon[0]
lons = [pt[0] for pt in exterior]
lats = [pt[1] for pt in exterior]
ax.fill(lons, lats, facecolor="#e8e0d0", edgecolor="#999999",
linewidth=0.3, zorder=1)
def generate_map(gadm_data):
fig, ax = plt.subplots(figsize=(8, 11), dpi=200)
ax.set_facecolor("#d0e8f5") # ocean / background
fig.patch.set_facecolor("#f8f8f8")
# --- Base layer: GADM regional boundaries ---
_draw_gadm_regions(ax, gadm_data)
# --- Rivers ---
for river_name, path in RIVER_PATHS.items():
lons = [p[0] for p in path]
lats = [p[1] for p in path]
ax.plot(lons, lats, color="#2060b0", linewidth=1.4, zorder=3, alpha=0.85)
# Label at the midpoint of the river line
mid = len(path) // 2
ax.annotate(river_name, xy=(path[mid][0], path[mid][1]),
fontsize=4.5, color="#1a3a80", zorder=6,
ha="center", va="bottom",
xytext=(0, 4), textcoords="offset points",
fontstyle="italic")
# --- Lakes (circles scaled by area) ---
area_scale = 0.006 # degrees radius per sqrt(km2)
for name, area, max_depth, vol, lon, lat, lk_type, quality, uses in LAKES:
radius = (area ** 0.5) * area_scale
circle = plt.Circle((lon, lat), radius, color="#3a80c0", alpha=0.6, zorder=4)
ax.add_patch(circle)
# Offset lake labels slightly above the circle so they don't sit on the marker
ax.annotate(name, xy=(lon, lat),
fontsize=4.0, color="#10306a", zorder=7,
ha="center", va="bottom",
xytext=(0, 3 + radius * 40), textcoords="offset points")
# --- Dams (red triangles) ---
dam_lons = [d[2] for d in DAMS]
dam_lats = [d[3] for d in DAMS]
ax.scatter(dam_lons, dam_lats, marker="^", color="#cc2200", s=18, zorder=5,
edgecolors="#800000", linewidths=0.4, label="Hydroelectric dam")
for dam in DAMS:
# Offset dam labels to the right and slightly up to avoid overlap with marker
ax.annotate(dam[0], xy=(dam[2], dam[3]),
fontsize=3.5, color="#800000", zorder=7,
xytext=(4, 3), textcoords="offset points")
# --- Municipal water intakes (green squares) ---
intakes = [
("Auckland", 174.76, -36.95),
("Wellington", 175.06, -41.22),
("Christchurch", 172.63, -43.53),
("Hamilton", 175.29, -37.79),
("Tauranga", 176.17, -37.69),
("Dunedin", 170.50, -45.87),
("Napier/Hastings", 176.90, -39.65),
("Palmerston North", 175.61, -40.36),
("Nelson", 173.28, -41.27),
("Invercargill", 168.36, -46.41),
]
intake_lons = [i[1] for i in intakes]
intake_lats = [i[2] for i in intakes]
ax.scatter(intake_lons, intake_lats, marker="s", color="#228822", s=16, zorder=5,
edgecolors="#115511", linewidths=0.4, label="Municipal intake")
for city, ilon, ilat in intakes:
ax.annotate(city, xy=(ilon, ilat),
fontsize=3.8, color="#115511", zorder=7,
xytext=(5, -2), textcoords="offset points")
# --- Map extent (full NZ, excluding Chathams) ---
ax.set_xlim(165.5, 179.0)
ax.set_ylim(-47.5, -34.0)
ax.set_aspect("equal")
ax.set_xlabel("Longitude (°E)", fontsize=7)
ax.set_ylabel("Latitude (°S)", fontsize=7)
ax.tick_params(labelsize=6)
# Y-axis: show positive values with °S suffix
yticks = ax.get_yticks()
ax.set_yticklabels([f"{abs(y):.1f}°S" for y in yticks], fontsize=6)
xticks = ax.get_xticks()
ax.set_xticklabels([f"{x:.1f}°E" for x in xticks], fontsize=6)
ax.set_title("NZ Water Resources", fontsize=12, fontweight="bold", pad=8)
# Legend
legend_elements = [
Line2D([0], [0], color="#2060b0", linewidth=1.4, label="Major rivers"),
mpatches.Patch(facecolor="#3a80c0", alpha=0.6, label="Lakes (size = area)"),
Line2D([0], [0], marker="^", color="w", markerfacecolor="#cc2200",
markeredgecolor="#800000", markersize=6, label="Hydroelectric dam"),
Line2D([0], [0], marker="s", color="w", markerfacecolor="#228822",
markeredgecolor="#115511", markersize=5, label="Municipal water intake"),
]
ax.legend(handles=legend_elements, loc="lower left", fontsize=5.5,
framealpha=0.85, edgecolor="#aaaaaa")
# Attribution
fig.text(0.5, 0.01,
"Boundaries: GADM v4.1 (gadm.org), CC BY 4.0. "
"River/lake data: NIWA, regional council records.",
ha="center", fontsize=5.5, color="#666666", style="italic")
plt.tight_layout(rect=[0, 0.025, 1, 1])
IMAGE_OUT.parent.mkdir(parents=True, exist_ok=True)
fig.savefig(IMAGE_OUT, dpi=200, bbox_inches="tight")
plt.close(fig)
print(f"Map saved: {IMAGE_OUT}")
# ---------------------------------------------------------------------------
# Main
# ---------------------------------------------------------------------------
def main():
# Load GADM regional boundary data
if not GADM_JSON.exists():
print(f"ERROR: GADM boundary data not found at {GADM_JSON}", file=sys.stderr)
sys.exit(1)
with open(GADM_JSON) as f:
gadm_data = json.load(f)
# Generate markdown
md_content = generate_markdown()
TABLES_OUT.parent.mkdir(parents=True, exist_ok=True)
with open(TABLES_OUT, "w") as f:
f.write(md_content)
print(f"Markdown saved: {TABLES_OUT}")
# Generate map
generate_map(gadm_data)
print("Done.")
if __name__ == "__main__":
main()Data Sources
- NIWA River Environment Classification (REC2) — River lengths, catchment areas, and flow data. NIWA flow data portal: https://niwa.co.nz/freshwater
- NIWA Lakes380 Project (Waikato University / NIWA, 2021) — Lake area, depth, and volume data.
- LINZ bathymetric surveys — Lake morphometry data for named lakes.
- MBIE New Zealand Energy Data File 2024 — Hydroelectric dam capacity and generation statistics.
- Electricity Authority Generation Data (EMI portal) — Actual annual generation by station.
- Meridian Energy, Contact Energy, Genesis Energy annual reports (2022–2024) — Dam-level capacity, reservoir names, and operator details.
- Taumata Arowai (Water Services Regulator) — Drinking Water Quality Register 2024; municipal supply source and treatment data.
- GNS Science Active Fault Database — Seismic risk context for Wellington and Christchurch water infrastructure.
- Wellington Water Ltd Infrastructure Strategy 2024–2054 — Wellington supply vulnerability assessment.
- GNS Science Groundwater Resources of New Zealand (2015) — Aquifer type, area, and recharge data.
- MfE National Policy Statement for Freshwater Management 2020 — Allocation status framework.
- Environment Canterbury Water Allocation Data 2023 — Canterbury aquifer allocation figures.
- NIWA Regional Climate Projections; MfE Environmental Indicators — Precipitation and runoff data for regional water budget.
- WHO Minimum Water Requirements in Emergencies (2011) — Basis for minimum survival water quantity estimates.
- GADM v4.1 Level 1 administrative boundaries —
scripts/data/gadm41_NZL_1.json(New Zealand regional boundary polygons; sourced from https://gadm.org).